
Mapping Participation
Mapping actor participation allows to inquire into the composition of issues and the engagement with specific issue terms. It is concerned with the contribution different actors make to processes of issuefication, the distribution of actors across issue and the intensity at which they engage with issue terms. Issue participation can also address interaction between actors, their commitment to the issue and process of actor migration within an issue. The involvement of actors in specific issue terms can function as indicator to explore their relative currency and provide insights into the dynamism of issues. On the web, the notion of actors can entail both individual, organizational and non-human actors, such as bots, algorithms and non-human entities (Niederer and van Dijck 2009). Actors can be approached as organisations, as individual profiles but also via their traceable activities.
Mapping participation, its distribution and intensity is generally based on identifying and capturing relevant activities measures over time in order to trace how participation is distributed within the network across different locations and different actors. Therewith, mapping participation allows to create dynamic issue topologies based on the intensity of issue participation. These topologies can give consideration to changes of activity intensity, activity location and actor composition across time. Of particular interest are the flows and dynamics of migration of actors within issue networks, indicating shifts in commitment.
A key concern in mapping participation is the interplay between collaborative dynamics and the specific activities and processes enabled by the technicity of associated online spaces. Participation, in this sense, is not only addressed as collaboration of minds, but as socio-technical process (Niederer and van Dijck 2009) between actors, issues and platforms.
The following recipes shows a route-map how to investigate a) relative and b) dynamic participation.
1 |
Determine actions and action spaces Determine the sphere, space or platform in which you want to map participation. Consider to which extend the chosen space allows to access and query performed actions and how the activities can be retrieved from the platform. Within each platform, issues might be relevant to a number of terms or sub-spaces, forming an issue related network. Identify these platform specific issue term networks, for instance through hyperlink analysis (link to recipe). The sub-spaces should be issue specific, active and interconnected. Decide on actions relevant to the space and the issue. These can be posts, edits, revisions or comments. In the case of Wikipedia for instance, each editor or bot can be considered as an actor, while edits and revisions pose relevant actions to track their engagement. On Twitter, issue networks can be identified through related hash-tags, while tweets, retweets and replies are relevant activities related to specific profiles. |  |
2
|
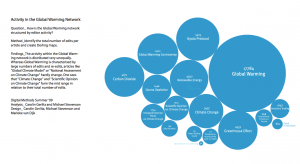
Identify relative activity within issue each issue term Determine the actions associated to each issue term/sub-space to identify relative and proportionate activity within the network. Use a device for visualising relative proportion, such as the Dorling Map Generator or the Bubble Lines tool to create a map of relative issue participation. Here are instructions to create Dorling Maps or Bubble Lines. |  |
3 |
Result 1: analyse relative issue participation The bubble visualisation shows relative activity related to issue terms. It allows investigating the proportionate importance of different terms in an issue network, providing insights into the composition of an issue and the commitment of actors to its specific themes at a given point in time. This approach is designed as starting point and first insight into issue participation related to specific issue terms, as it only provides a temporal snap-shot. |
 |
4 |
Participation over time In order to address concerns of issuefication and dynamism, a temporal dimension shall be added to the above approach by repeating the same process for a series of selected temporal intervals. Identify the total temporal interval in which actor participation shall be tracked and decide for sub-intervals to capture transitions in the overall interval. The selection of sub-intervals depends on the desired level of granularity in relation to the time span and the intensity of activity that shall be traced. In order to capture participation as continuous process, doing without intervals at all is of course desirable, but tied to possibilities of dynamic visualisation of continuous activities. Retrieve the activities for each issue term in relation to all selected sub-intervals. The rates of activity in each interval show the intensity of participation in relation to the specific term over time. To visualise such relational intensity, you can use the Bubble Line tool, turning each interval into a same sized bubble on a line and using colour opacity to determine the relative intensity of participation at each instance. | 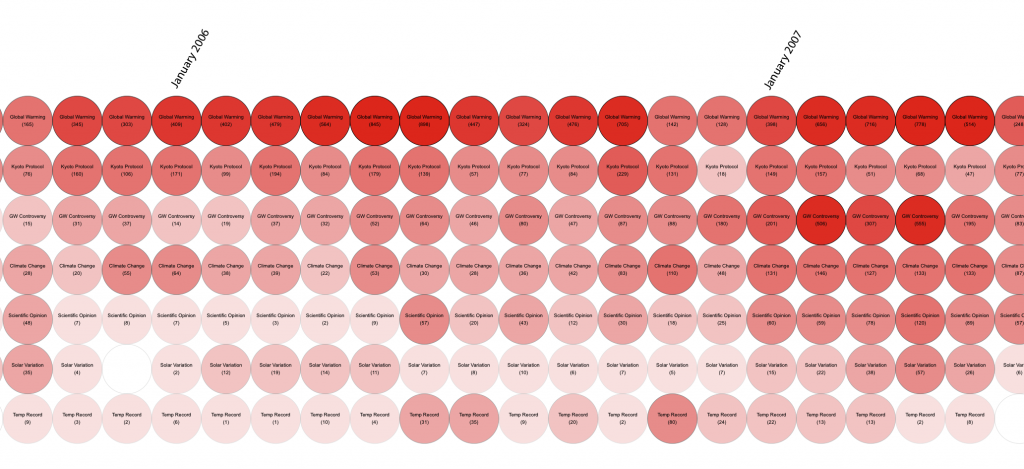 |