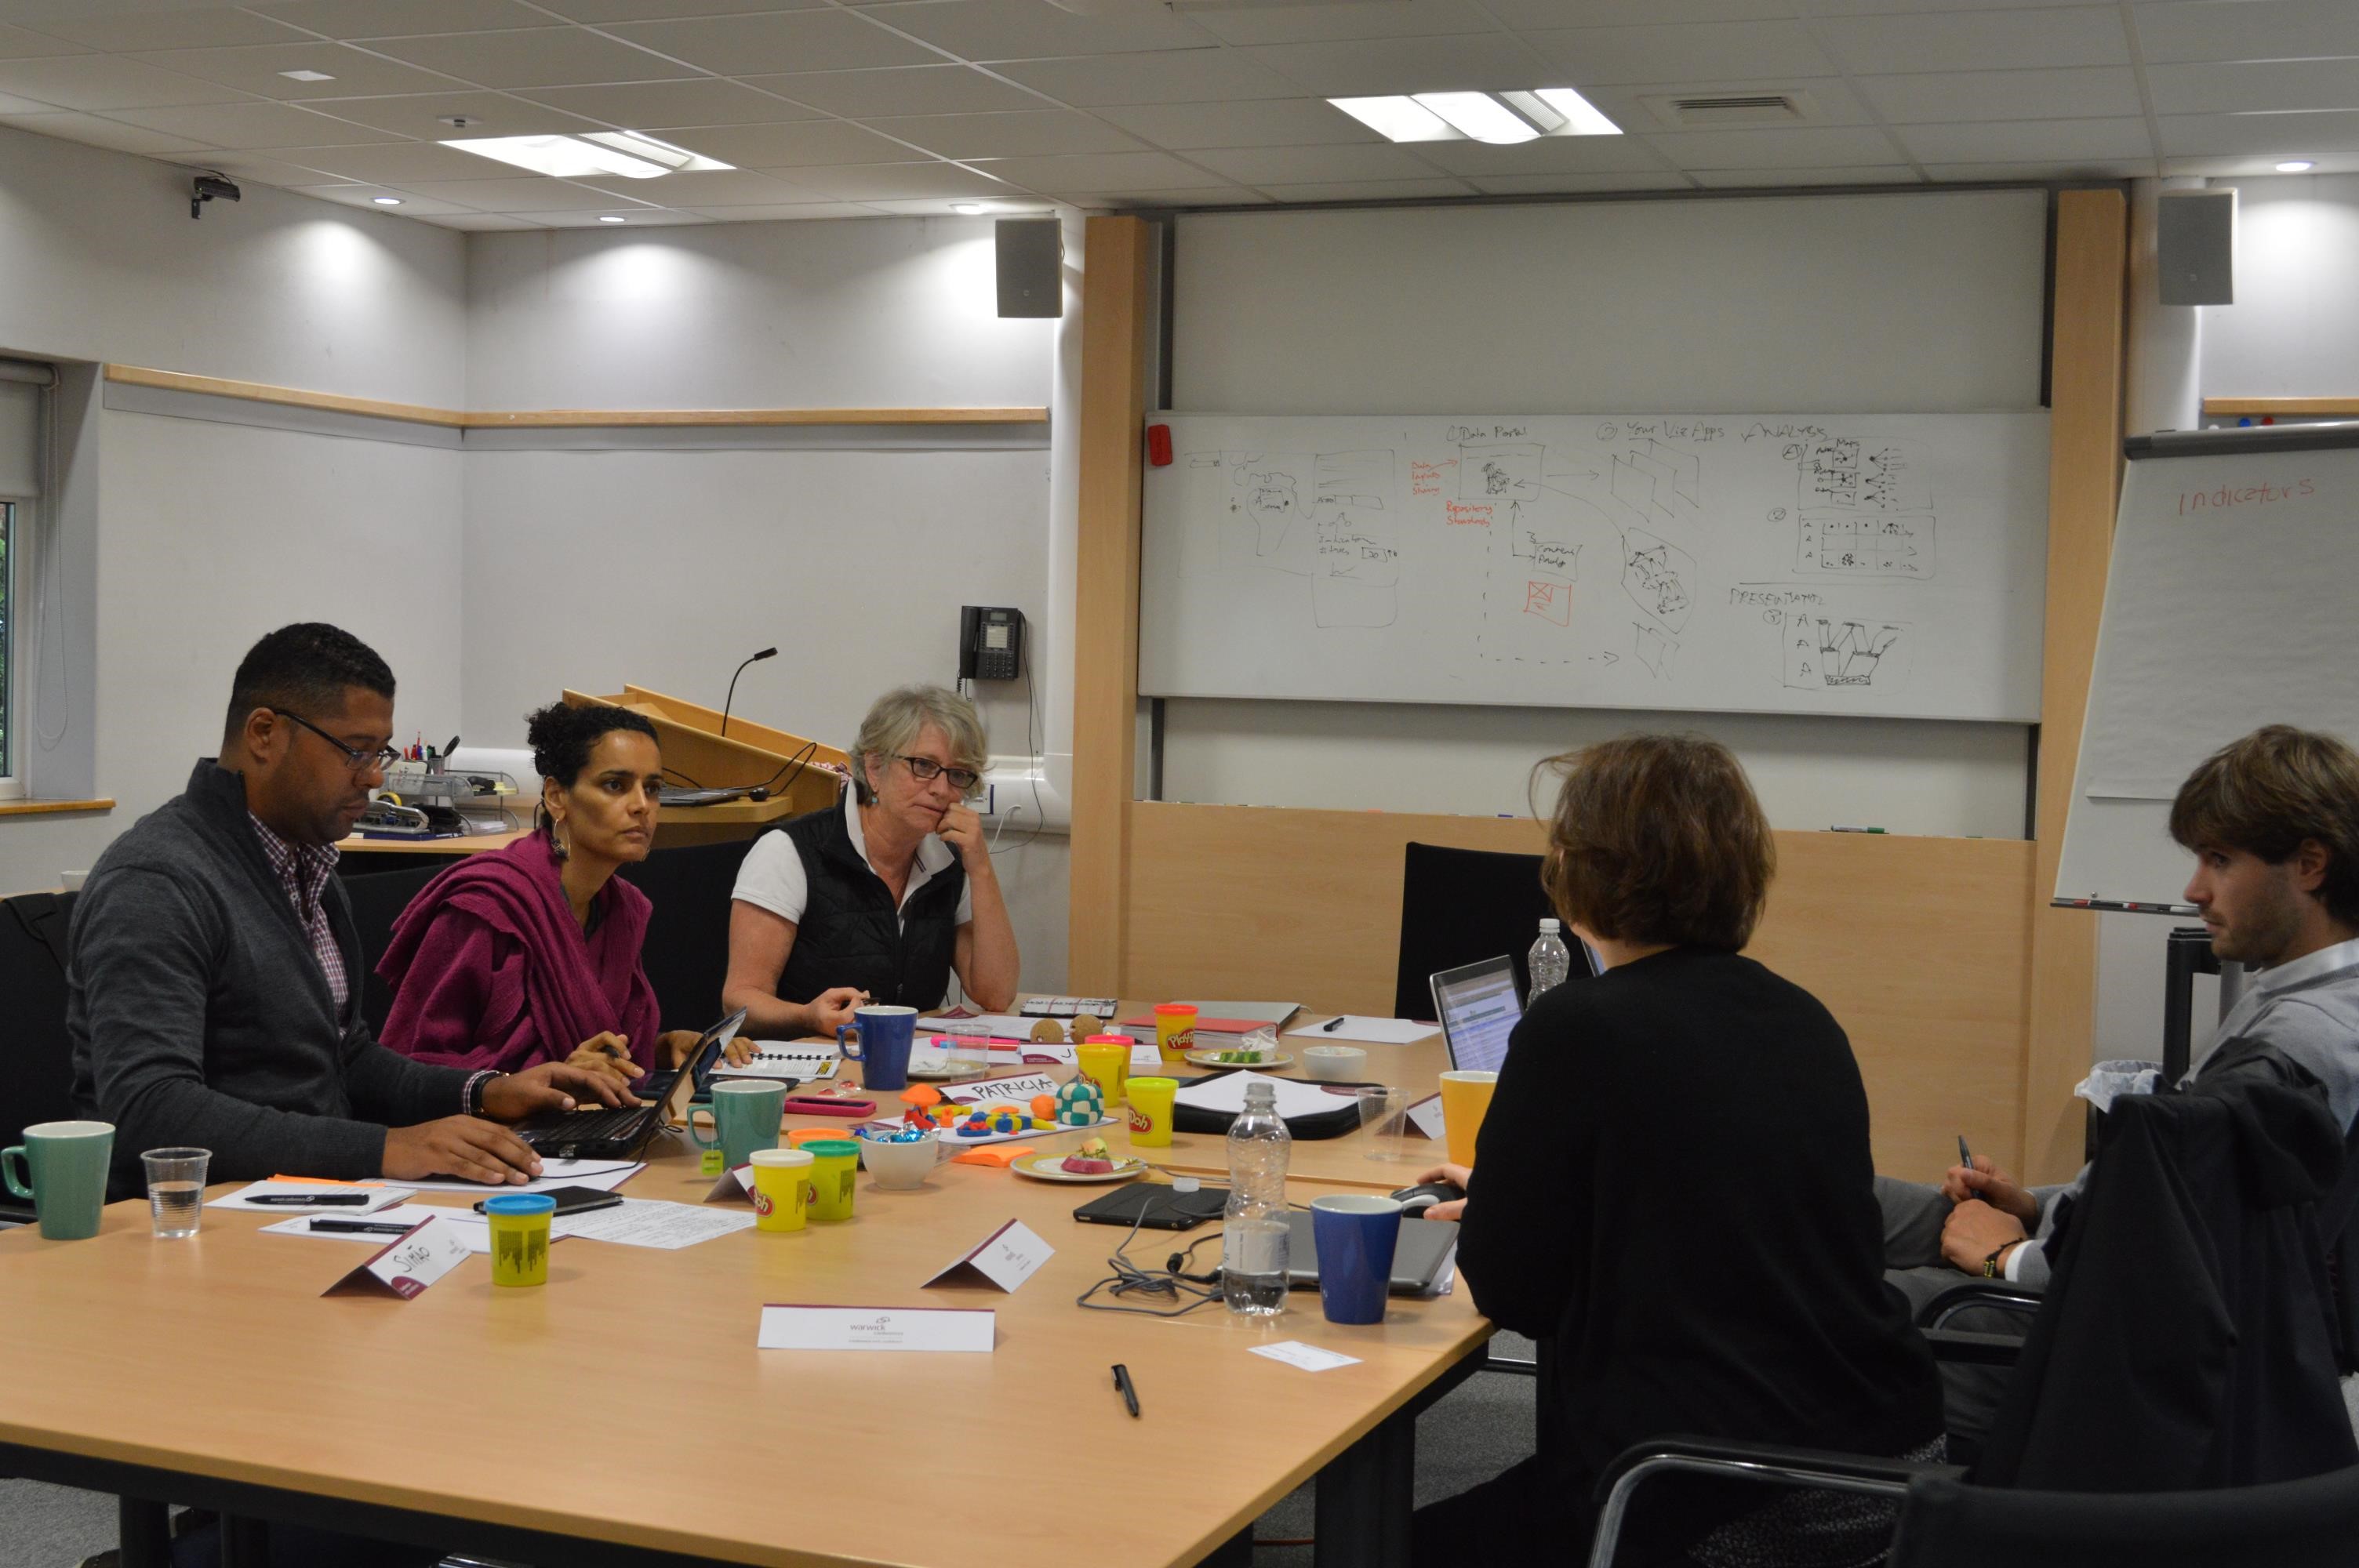
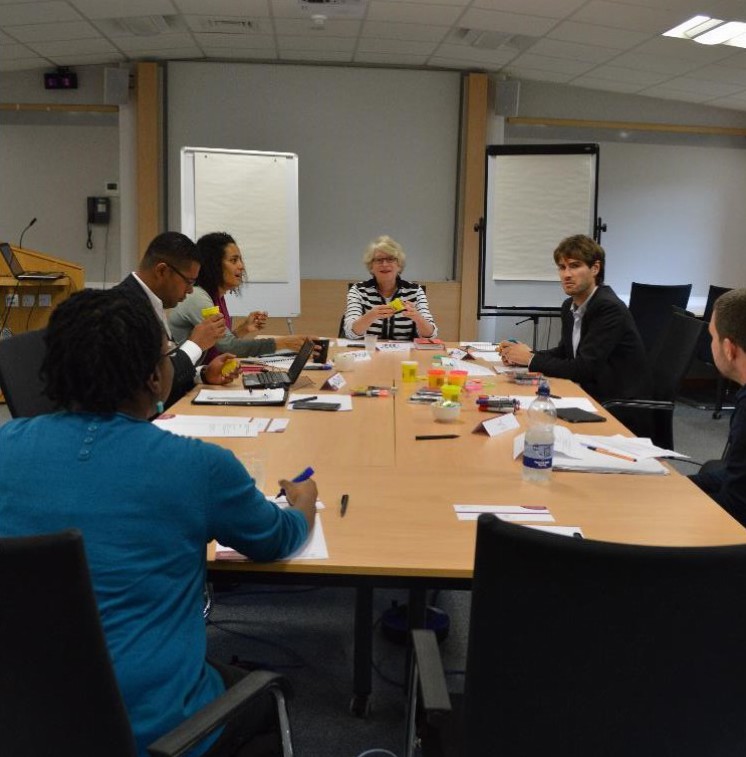
The second series of working meetings were held at the University of Warwick from 26-28 October. The meetings consisted of in-depth discussions, brainstorming and agreements on a series of issues related to how to consolidate the method and further the development of the platform. A small group of 9 participants joined the meeting from a range of stakeholder groups (University of Cabo Verde, UNDP, FAO, University of Warwick), bringing a range of expertise to the table, including sociology, agricultural science, data visualization, designers, big data, architecture, climate change adaptation, disaster risk reduction, ecosystem services and software development. Even their creativity was tested with playdough!
The key issues discussed included the following:
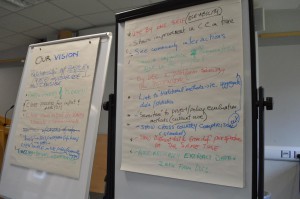
Vision for the platform: What do we want to see in the long term? What questions does this raise for our work to be completed by December?
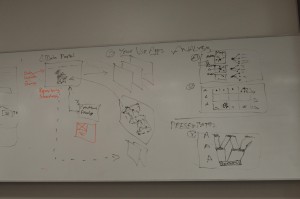
Data input and Structure: How do we design the “Back Office” such that the data is organized and relationships between the different data points are captured? Different content types were discussed, and the various fields associated with them defined to identify the linkages between them
Data Visualization: What do we want to see on the front end? The interface will aim to clearly display multiple analytic perspectives of the same data, which includes four priority components: a map (geographic/spatial element), a timeline, a network (illustrating linkages between content types), and content analysis (analysis of the text to understand the substance).
Structure of the Platform: How can we organize the platform, and what is realistic to deliver by December? There will be the development of a “data portal,” where the data is input and organized according to the innovative methodology in order to compile a complex database. The database would then feed into a series of visualization “apps” which could look at the data in a range of different ways. The focus for December is on the four visualizations outlined above.
Cabo Verde Research: telling the story – Drawing from the research being undertaken in Cabo Verde, a series of insights were identified, that have been uncovered using this approach. These insights will become the “story” that is told, using the platform as the visual tool to display the evidence for that story.
As on main takeaway from the meeting, it was agreed that the aim of this work is to, in effect, “contextualize the indicators.” As such, it was suggested that the indicator act as a starting point, and the specific context be built around these indicators – that is, the relevant actors, actions and other artifacts that allow for a deeper understanding of what this indicator means and how it was achieved, in order to monitor, learn and replicate good practice.