
Liveliness of Issues
Austerity and Crisis: Detecting the Liveliness of Issues with Twitter and Google
from: ‘Scraping the Social Issues in real-time research‘, subm. Journal of Cultural Economy (Noortje Marres and Esther Weltevrede)
This case study explores the possiblity of detecting the liveliness of issues using Twitter and Google. We would like determine how ‘happening’ our two selected topics, ‘austerity’ and ‘crisis,’ are on these platforms, and ask: are there any significant fluctuations in the composition of these issues, and if so what are they?
Using the Twitter Analytics Beta Platform developed by the Digital Methods Initiative, we scraped Google and Twitter for pages and tweets mentioning our two key words ‘austerity’ and ‘crisis’, for the duration of some months.1 As part of this scraping exercise, data on the relative prominence (currency) of these key terms was collected as a matter of course, but we were especially interested in establishing the variability of these two key words.We also wondered whether we could distinguish between different modes of fluctuation: are we able to recognize ‘newsy’ and more ‘social’ forms of variation in this issue’s composition? Do newsy issues, for instance, come in bursts, traceable to newsworthy events? What would be the signature of issues that are also socially alive? We then treat variations in the key-words with which our term is associated into an indicator of the liveliness of certain terms.
Adopting this method, we decided to rely on techniques of co-word analysis, which is well-established in scientometric research and other forms of content analysis (Leydesdorff & Welbers 2011; Callon et al 1983; Danowski 2009; see also Marres 2012). In our version of co-word analysis, we chose the tweet and the snippet on a Google return page as unit of analysis for the co-occurrence of words. Our space of analysis thus delineated, we subsequently rendered our data as co-word clusters using the network analysis and visualization software Gephi, with the aim of documenting their variation over time.
But, how do we decide which fluctuations are relevant, in a methodologically sound manner, among the 20.000 word associations we for instance discovered in four days of tweets? One way would be to devise a criterion of variability: which words are most variable in their composition (co-words)? Which of our issues are associated or ‘charged’ with many different co-words on different platforms, or in different ‘media spheres’? For instance, is crisis an economic issue in some places, both mostly environmental in others? However, with this feature currently lacking in our co-word machine in-the-making, we decide to re-admit a measure of currency, allowing the frequency of mentioning to inform our analysis of liveness.5 Thus, in this initial sketch of the liveliness of ‘austerity’ on Twitter and Google, we only included co-words that occurred a minimum number of times in our corpus (Figure 6 and 7).6
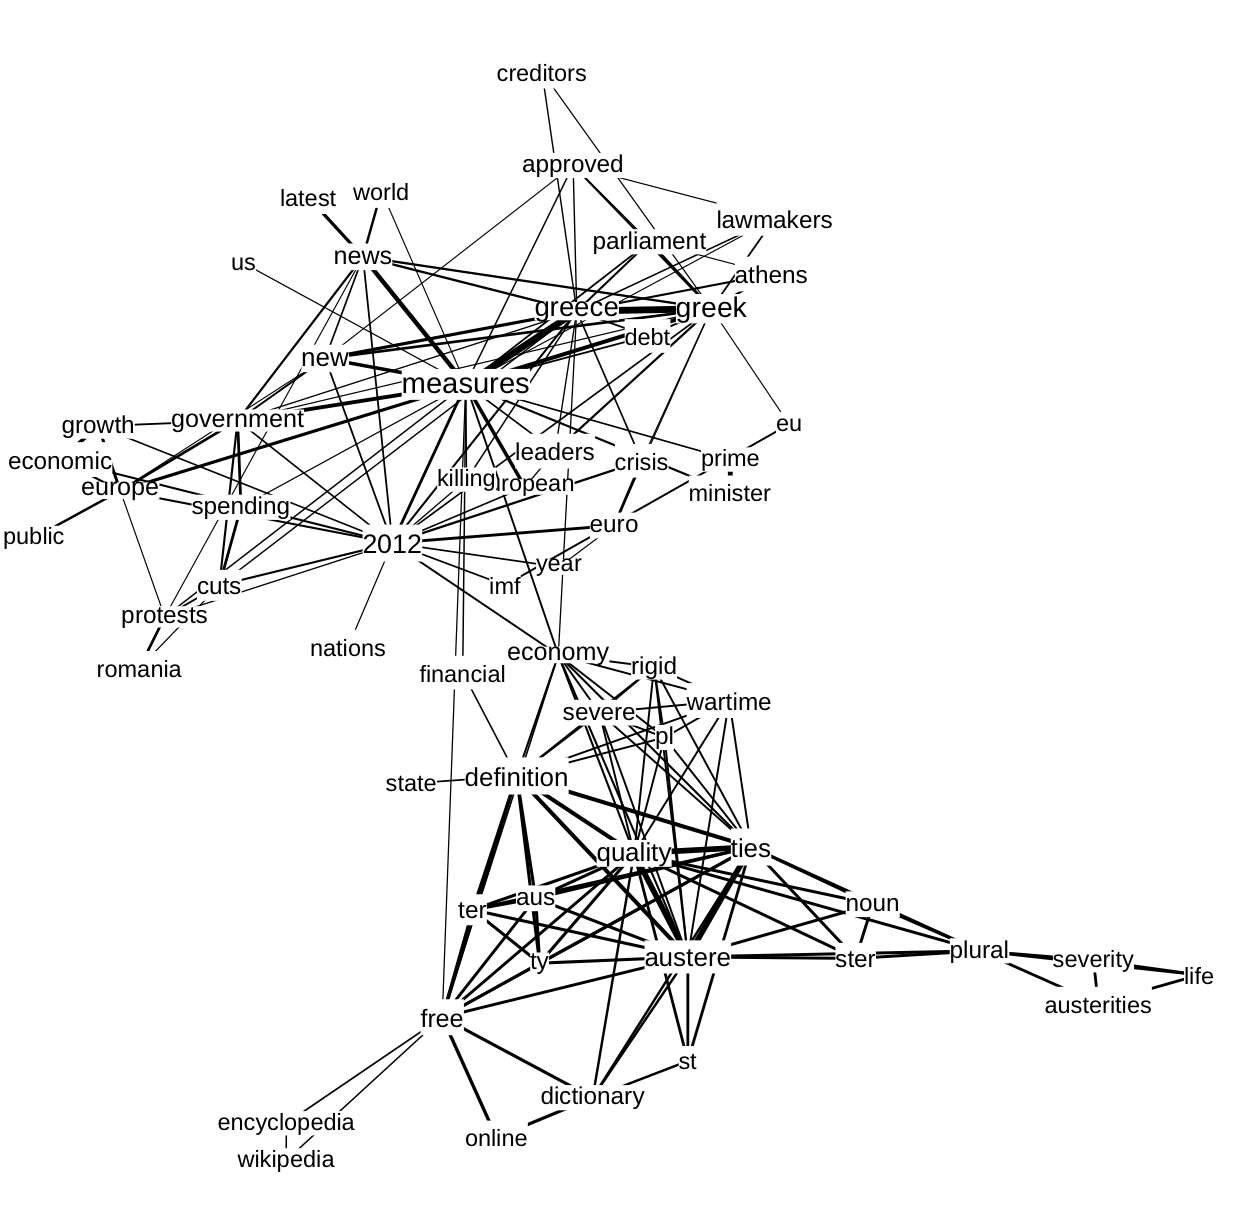
Figure 6. Co-words related to austerity derived from Google result pages, 1-31 January 2012.
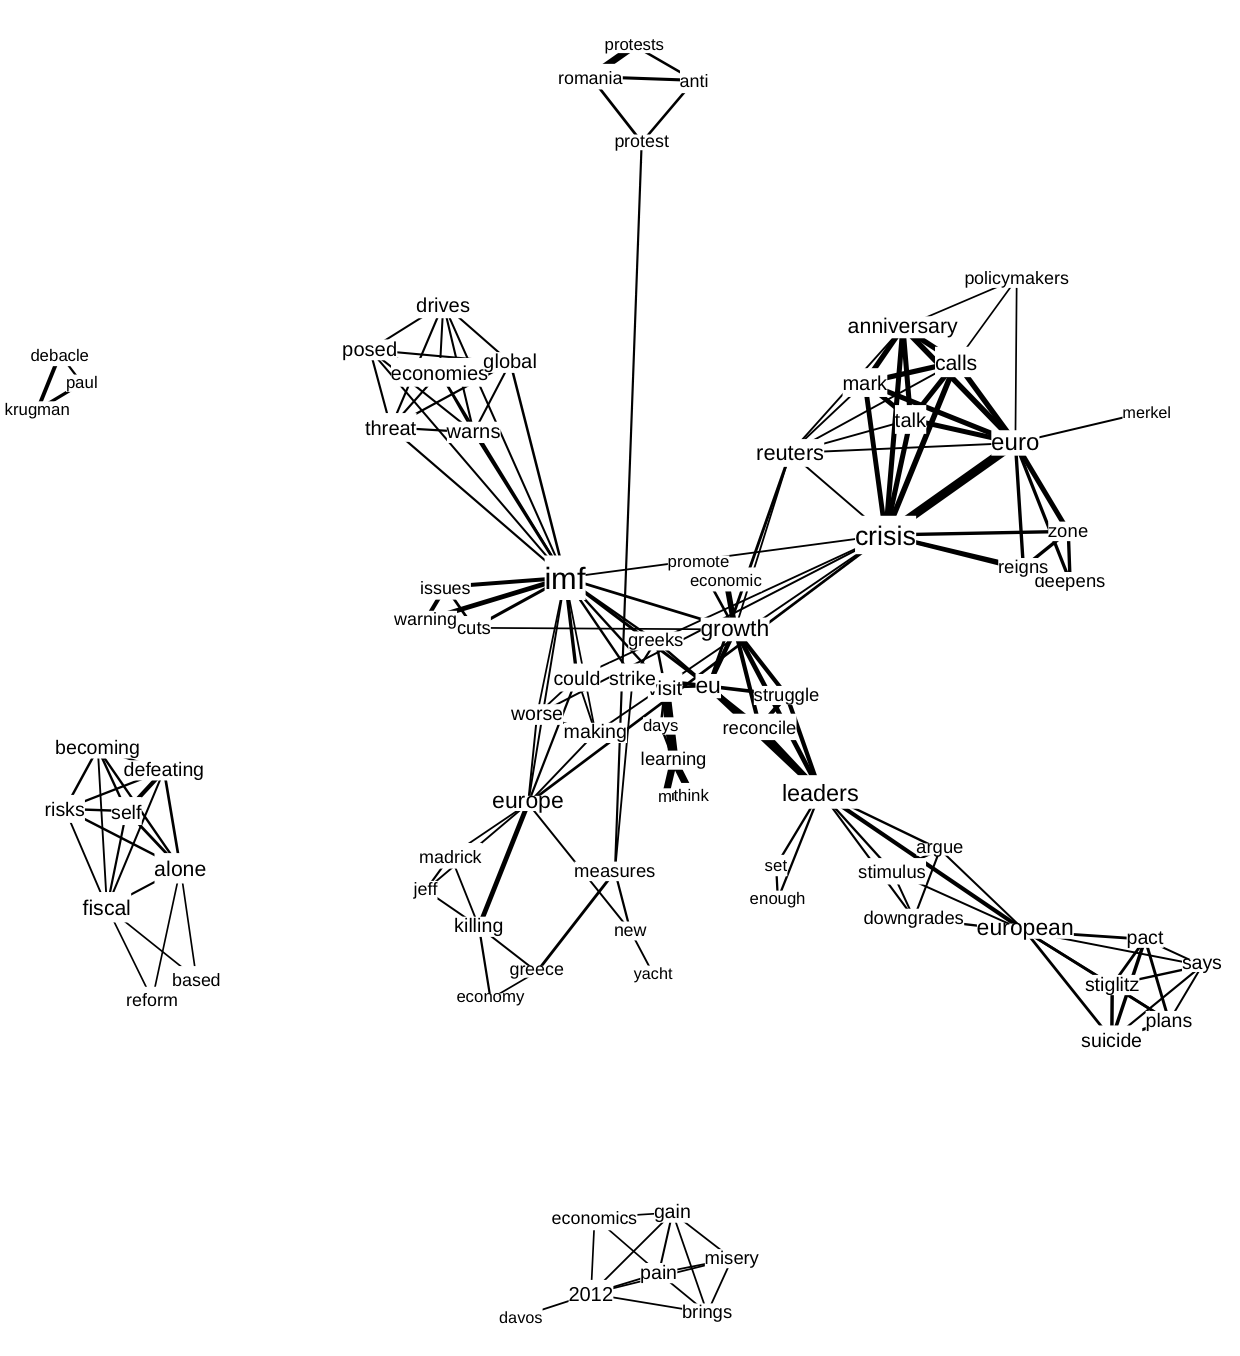
Figure 7. Co-words related to austerity derived from the Twitter stream, 1-31 January 2012.
In exploring our initial co-word maps, it became apparent that the hold of ‘liveness’ on our respective platforms, Twitter and Google, goes well beyond the prevalence of currency measures in scraper-enabled analyses of these platforms. As it turned out, the very content of our analysis reverberated with the ‘language of the wire’ – the terms that had been occupying the news of the period in question (greece, imf, bailout, protest). (Thus, the co-word network graph based on Google snippets (Figure 6) shows different national governments and their respective austerity measures – cuts in Romania are accompanied by protests; a new package for Italy and Spain; and Athens’ parliament approves new bailout.7 In many cases, the prevalence of the news in these channels was literally apparent: in the Twitter co-word network clusters formed around specific documents that receive attention, such as a guardian article with the title “IMF warns of threat to global economies posed by austerity drives.”8 For both platforms, we checked which sources are referenced in the data: a host-count of sites found in the Google results and tweets containing the word pair austerity and crisis indicates that both spaces are dominated by news sources. Austerity, then, is a highly newsy term, both in terms of the terms and actors composing this issue, at least in the online platforms under scrutiny.
In the second sketch of the liveliness of ‘crisis’ on Twitter and Google, we decided to only use hashtags in Twitter instead of co-words and thus resorting to medium specific data formats. This methodological choice leads us to include a reasonably sized set of connected hashtags with a minimum strength of connection of 5. Additionally, we decided to reduce the data by focusing on a limited set of 4 days of data instead of excluding fine-grained co-words from analysis by raising the threshold of connection strength (Figure 8 and 9). Interestingly, by focusing our analysis on co-hashtags the lively terms emerge around newsy terms: wecanbeheros, screwyouassad, freechina en eurodebtcrisis.9 The visualisation shows static terms – i.e. terms that occur across four days – in dark grey, and terms that are dynamic – i.e. occurring in three days or less – in red. The static terms provide the context for the dynamic words.
The difference between the two Web devices for the same term is again significant. Compared to the Twitter co-words, which feature the euro crisis and in the periphery figure specific local crises, the co-words taken from the Google results focus more on the infrastructure of crisis – support, help, services, support, rape, women. The comparative co-word analysis thus shows the multiplicity of the object in different Web devices.Furthermore, the co-word visualization from the Google results seems to indicate that Google results are less volatile, however, this is most likely due to the limited number of days under analysis. The project and tool Issuedramaturg convincingly captured the volatility of Google results over a longer date range.10
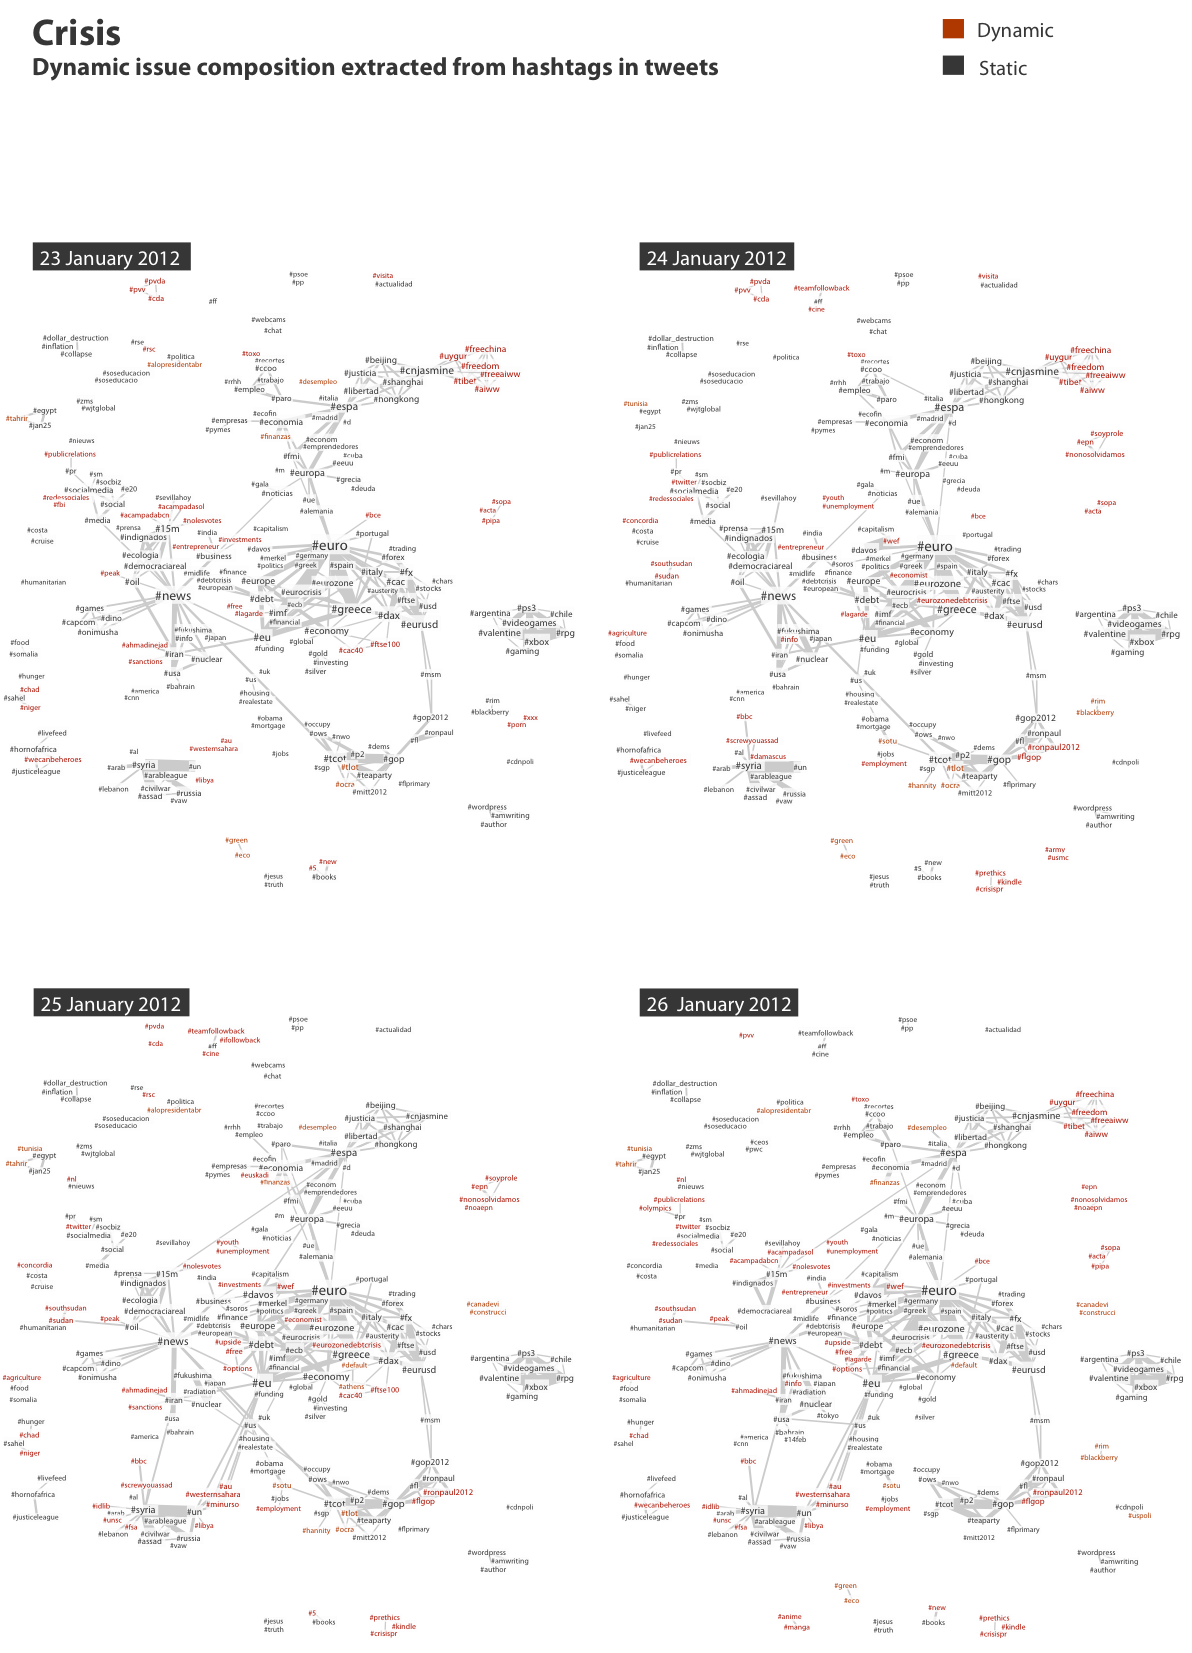
Figure 8: Issue profiling crisis with related hashtags in Tweets, 23-26 January 2012.
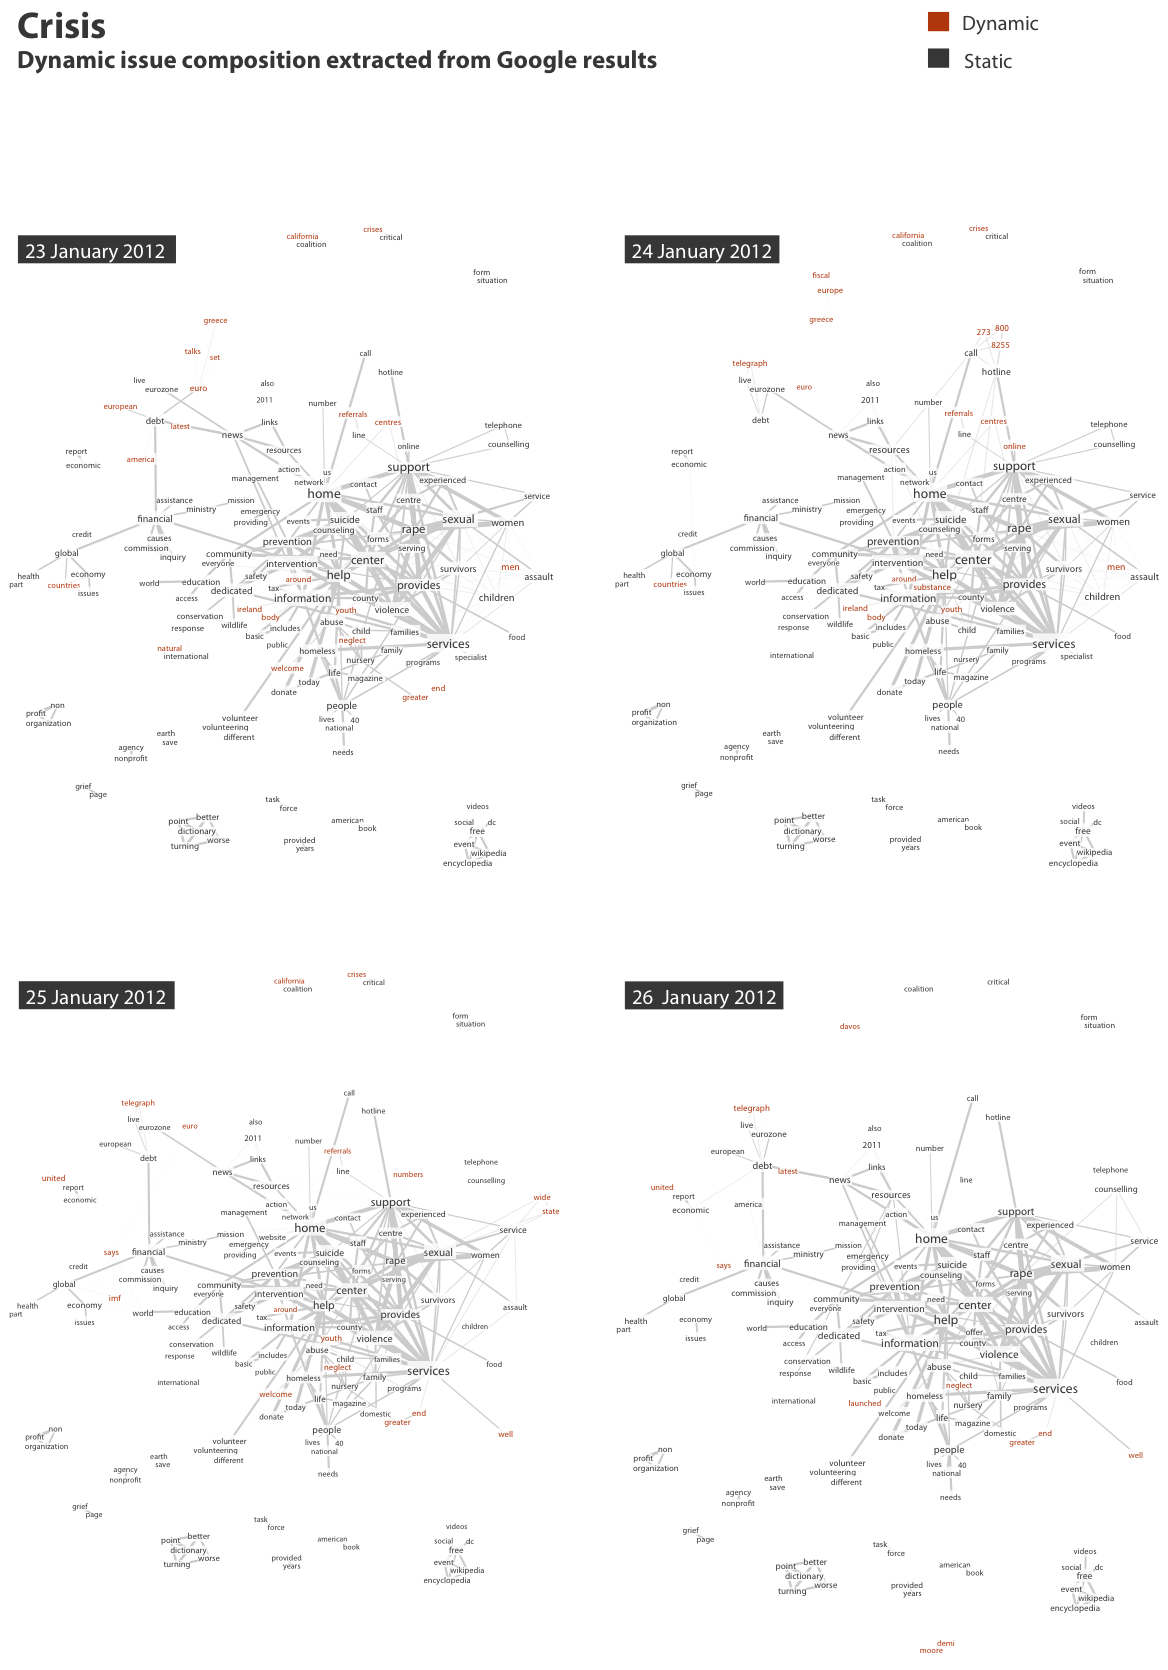
Figure 9: Issue profiling crisis related words in Google results, 23-26 January 2012.
The challenge of adapting techniques of scraping to the purposes of social research, and to move from the analysis of liveness to liveliness, is thus not just a methodological challenge, but equally a challenge addressed to ‘the medium’ itself. Importantly, though, when we delved into the detail of the newsy ‘austerity’ co-word data returned by our scraper-in-the-making, we did seem to find clusters of terms, which to our minds at least reverberated with the social: for instance, valentinespoems; merkelnotmychancellor; solidaritywithgreece; bankstergansters; inflation; depressed; isolated; capitalism; silver; assholes.
Here we were reminded of a warning made by sociologists inspired by Gabriel Tarde, which has raised some serious doubts about the sociological ambition to move ‘beyond’ journalism: the circulation of news, they argue, plays a central role in structuring social life in mediatized societies, and if we were to try and edit it out of our analysis, we would end up turning much of social life into a mystery (Latour & L’Epinay 2008; Barry 2005). In adapting scraping for the purposes social research, it would then be a mistake to try and ‘route around’ the news. Rather, our challenge is that of how to render legible the much more fine-grained variations we are intuitively inclined to associate with the social: cruelly or perhaps justly so, we found that the more ‘social’ – less regulated, less official, less formal – co-word variations were much more resistant to visualisation than the broad-stroked newsy dynamics. The challenge of adapting scraping as a technique of social research is then at least in part a challenge of data selection and visualisation.
- We are grateful to Erik Borra and Bernhard Rieder for their help. Using the Twitter and Google analytics platforms currently under development, we scheduled an ongoing data collection from 1 January in Google and Twitter for ‘austerity’ and ‘crisis.’
- Web devices Google and Twitter each design access to the data differently and thus the scraping procedure slightly varies accordingly. In Google we collected a daily snapshot of the result page for ‘crisis’ and ‘austerity,’ and in Twitter we collected all tweets containing the keywords coming through the public API as it happens. The unit of analysis from the Google result page is the individual result – set to 100 results per page – which consist of a title and a snippet; in Twitter the unit of analysis is the individual tweet. For instance in one of the cases below we used 4 days of data, which contains approximately 400 snippets and just under 145.000 tweets. Note that for analytical purposes we chose to retain only unique tweets, not taking into account retweets. The use of retweets as analytical device is useful to boil down the number of tweets following a popularity metrics, or put differently, to find those tweets that have pass along value (Weltevrede 2011). In this case the aim is instead to filter out words following a liveliness metrics, focusing on the intensity of connections between words contained across a heterogeneous set of tweets (Marres 2011).
- Whereas Twitter provides each individual tweet with a date stamp indicating when it was published, Google only returns a date stamp for relatively small portion of results. The date stamp we collected for the Google snippets is instead derived from the day we captured the result page and the result is found present in the top 100 results for the query ‘crisis’.
- Another way would be to devise a criterion of variability: which terms are associated with a varying set of co-words, with X numbers of co-words varying in period X.
- Co-words in the month January in Twitter where only retained if they occur in 100+ tweets per day, and in Google we retained those ties that occur in 30+ snippets per day. Visualizing the co-word networks in Gephi, the connecting word ‘austerity’ was removed to allow a sparser graph. Additionally also an editorial choice was made to remove formatting language specific to the medium – e.g. ‘retweet,’ ‘via,’ ‘hours ago.’
- The co-word network also shows fears that the euro crisis and specifically the austerity measures might be killing the European economy. Additionally, there is a cluster with definitions of the word austerity. In the Twitter stream the countries figure less prominent (Figure 7). The Romanian protests and the new measures in Greece are present, but more prominence is given to the IMF and the euro crisis. It is notable that specific names figure more prominently, such as Joseph Stiglitz, Jeff Madrick and Paul Krugman- all three are economics critical of austerity measures.
- Elliot, L. (2012) ‘IMF warns of threat to global economies posed by austerity drives’, The Guardian, January 20. Available at: http://www.guardian.co.uk/business/2012/jan/20/austerity-warning-international-monetary-fund (accessed 20 March 2012).
- Due to the multilingual term ‘crisis’ there are clusters of different languages to be found, including Spanish, Dutch and English.
- The project is located at: https://dramaturg.issuecrawler.net/issuedramaturg_story/911truth.org.html, accessed 22 March 2012.