Reading Dashboards: Data, Algorithms and Decision Making is a project led by Dr. Nathaniel Tkacz at the Centre for Interdisciplinary Methodologies at Warwick University and funded by the Economic and Social Research Council.
The project runs from September 2014 to April 2016 and is set to explore the role played by dashboards in allowing individuals and institutions to interact with and act upon different data forms in organisational and everyday contexts. In recent times dashboards have become increasingly common features of business, public policy and everyday life. The term refers to a way of representing multiple indicators, data and news, in real-time and side by side. Organisations have historically built dashboards so as to display what were defined as ‘key performance indicators’ for example, on which decisions can be based and taken. However, with the rise of Big Data and the proliferation of smart devices in everyday life, this type of display is increasingly available for individuals for everyday activities. Many dashboards offer today a way of bringing together various sources of data into a handy, usable and actionable format.
The main research questions that guide this project are: how are organisations and individuals using dashboards? What kinds of indicators are used and for what purposes? What is the temporality or liveliness of these indicators? How are dashboards incorporated and transforming decision making processes? Are dashboard evidence of a general transformation in the temporality of judgement and decision-making? How do individuals cope with the multiplicity and inconclusiveness of dashboard indicators?
February 2016 – DESIGN AFTER PLANNING CONFERENCE
Nate participated at a one day interdisciplinary conference held at the University of Westminster that explored the possibilities of going beyond the limitations of liberal-modernist policy-making and urban planning and the implications of doing so. His talk, entitled ‘Dashboard, Designs, Principles and Data Signals’ can be watched here.
December 2015 – BIG DATA, SOCIAL DATA
Ana presented a paper entitled ‘Big Data and the Economy’ at an event on Big Data organised by Warwick’s Q-Step Centre. The paper explored the new challenges poised by the new circulation and different mode of visually presenting economic indicators. You can listen to Ana’s talk here.
June 2015 – DATA POWER CONFERENCE
Nate presented a paper entitled Cognitive Scaffolding and the Data Unconscious: On Decision Support Systems at the Data Power Conference. Here’s the abstract:
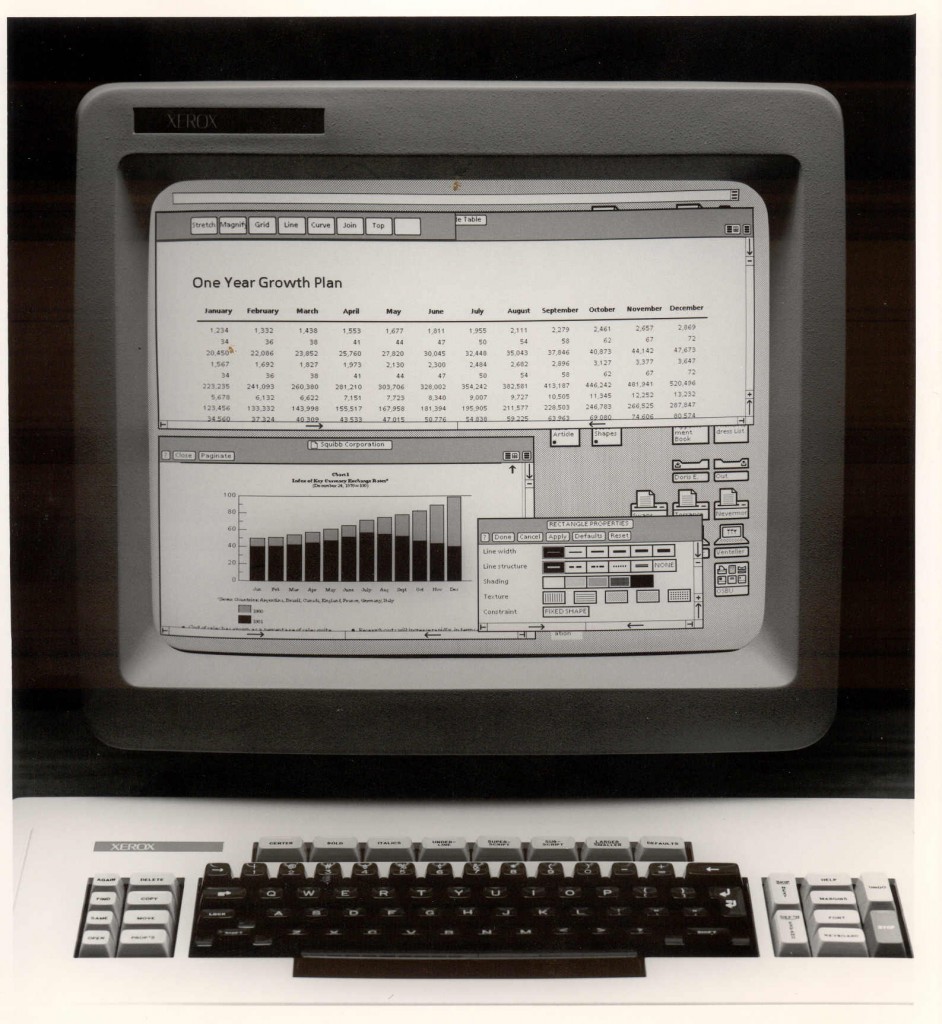
As both a branch of management theory and a set of real implementations, Decision Support Systems (DSS) first emerge in the 1950s. DSS bring together conceptions of organisational structure, practices of managerial decision-making and computing into relation for the first time. Organisations are conceived as having three levels of operation, each corresponding to its own types of decision-problems, from highly structured at lower levels and unstructured at higher levels. DSS are one of the first systems to use computers to collect data about the performance and overall operation of an organisation or other system. In this respect, all contemporary organisations the routinely collect, visualized and used data to make decisions are indebted to DSS.
Genealogical inquiries into DSS reveals much about the data-driven present. It shows how computational systems deployed within organisations not only foster and encourage specific modes of attention and perception, but how actual implementations are derived from managerial and organisational thought. As semi-automated forms, DSS operationalise and thus make durable a managerial weltanschauung, and fold in conceptions about the user, the limits of automation, what must and can be ‘datafied’ and to what ends. Interrogating this history is urgent as even the most cursory glance of contemporary literature – on business performance dashboards, for example – reveals that the founding concepts and systematic arrangements of this field still inform the present, though in largely unconscious ways.
May 2015 – THE POLITICS OF BIG DATA
Nate presented some of the work we have undertaken as part of our empirical study of the use and design of dashboards at the Government Digital Service as part of The Politics of Big Data Conference. The paper was entitled The Performance Platform: Governing through Design and here is the abstract:
The routine operations of government are being transformed through the implementation of new online platforms, web analytic and user research techniques, ‘agile’ (management) methods, and the introduction of design principles. Government is understood as a standardized platform; its services subject to continuous performance measures and data analysis, and its citizens reconfigured as users. Recognising that data-driven systems have long been part of business intelligence and performance management, I reflect upon an ongoing study of Government Digital Service to consider what is unique about these practices coming together in public administration.
January 2015 – DIGITAL METHODS INITIATIVE
Nate was invited as keynote speaker at the seventh Digital Methods Initiative’s Winter School entitled ‘Show me Your Dashboard: New Media Monitoring and Data Analytics as Critical Practice’. You can download Nate’s paper here.
October 2014 – CYBERSALON
Nate discussed dashboards in the context of a Cybersalon talk and in conversation with Raul Espejo, former Operational Director of Project CYBERSYN. The seminar explored the contrast between Stalinist economic management and visions of a bottom-up cybernetic communism. You can watch the talk here.
October 2014 – INTERFACE CRITIQUE
Ana attended the Interface Critique Conference on Nate’s behalf at UdK Berlin. A range of speakers from different backgrounds were brought together to talk about different types of interfaces: communicational, spatial, computational, etc. We presented an outline of our research project and suggested how by observing the use of dashboards in a range of settings our project seeks to problematise these types displays as interfaces which afford a range of effects to unfold. We also speculated around the notion of ‘unequal calculating capacities’ (coined but not thoroughly explored by Michel Callon 2007) in order to think about how the use of dashboards might intervene in reproducing information and therefore calculating asymmetries.
October 2014 – PROGRAMABLE CITY SEMINAR
Nate gave a talk at the Programmable City Seminar at Maynooth University. You can watch Nate’s talk here.
October 2014 – PROJECT LAUNCH AT DEMOS
Academics, public and private sector representatives gathered together on the 10th October of 2014 at DEMOS’s office in London for the launch of our Dashboard project. An introduction was given by Carl Miller one of our partners at DEMOS-CASM who highlighted the need to explore how dashboards need to be interrogated and critiqued further both from an academic as well as policy perspective. You can listen to the full discussion here
DASHBOARD GALLERY
-
Internet Live Stats
A dashboard showing real time data of internet usage

-
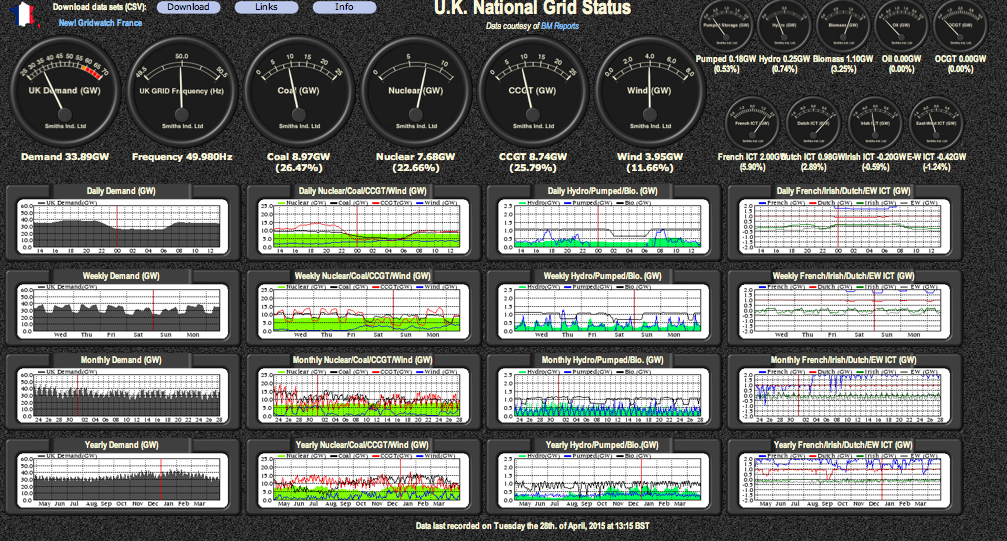
National Grid Monitoring
A dashboard monitoring the UK's national energy consumption and electrical grid status.
-
Real Time Energy Dashboards
Real-time energy consumption dashboards are being publicly displayed in a range of organisations.

-
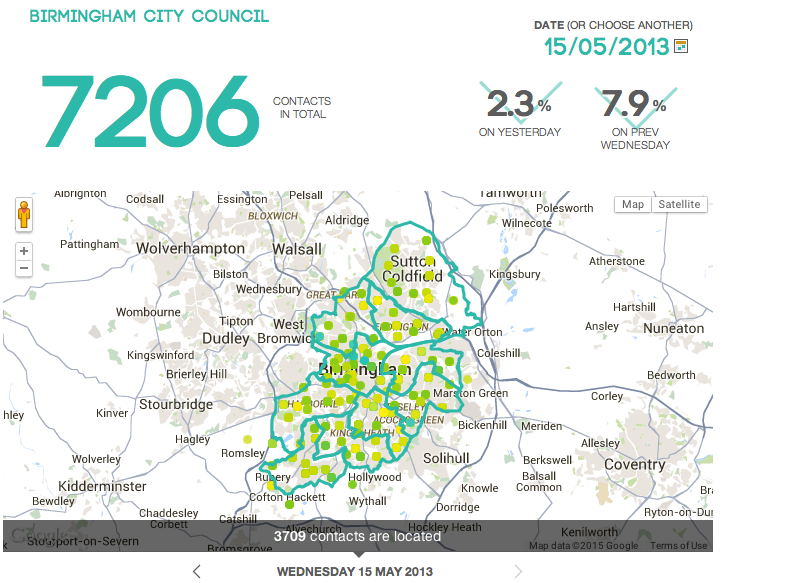
Birmingham Civic Dashboard
A dashboard accounting for the service delivery of Birmingham City Council
-
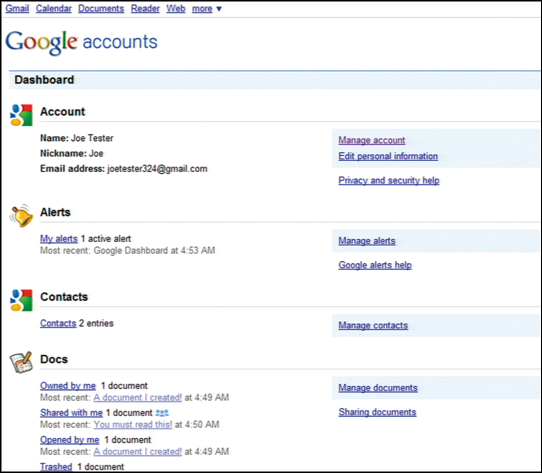
Privacy Dashboard
Google as well as some newly developed add-ons enable users to oversee the private information held in their accounts in a dashboard format.
-
Democratic Dashboard
A website enabling citizens to acquire and organise a range of information to inform their decisions regarding the next General Election in the UK.

-
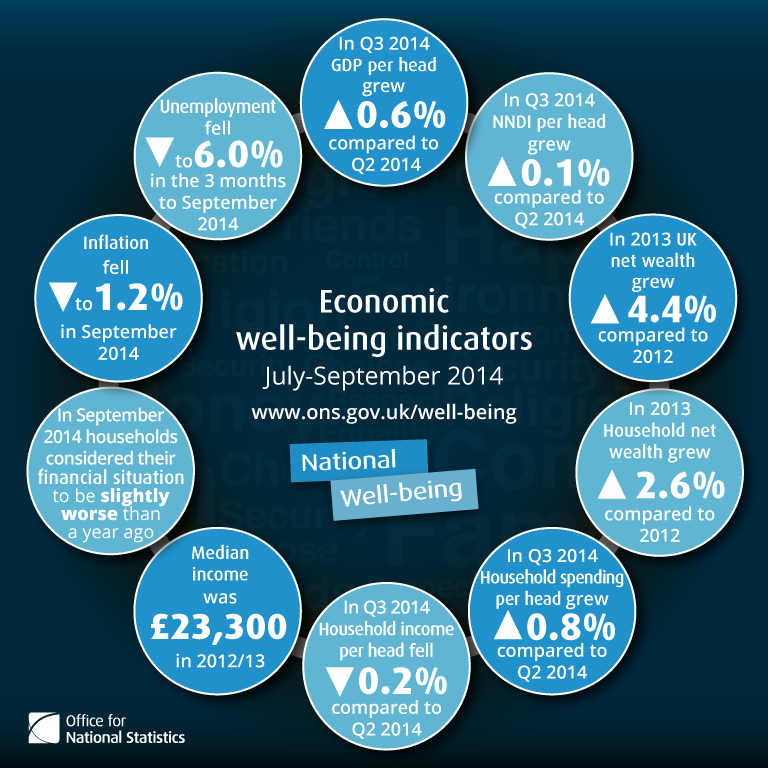
Wellbeing Dashboard
The Office of National Statistics in the UK has recently started publishing GDP figures as part of a wellbeing dashboard comprising a set of seven additional indicators.
-
Disaster Dashboard
A dashboard has been developed according to techwire in partnership between San Francsico's City Department of Health and civic tech company Appallicious to help the city prepare and recover from natural disasters.

-
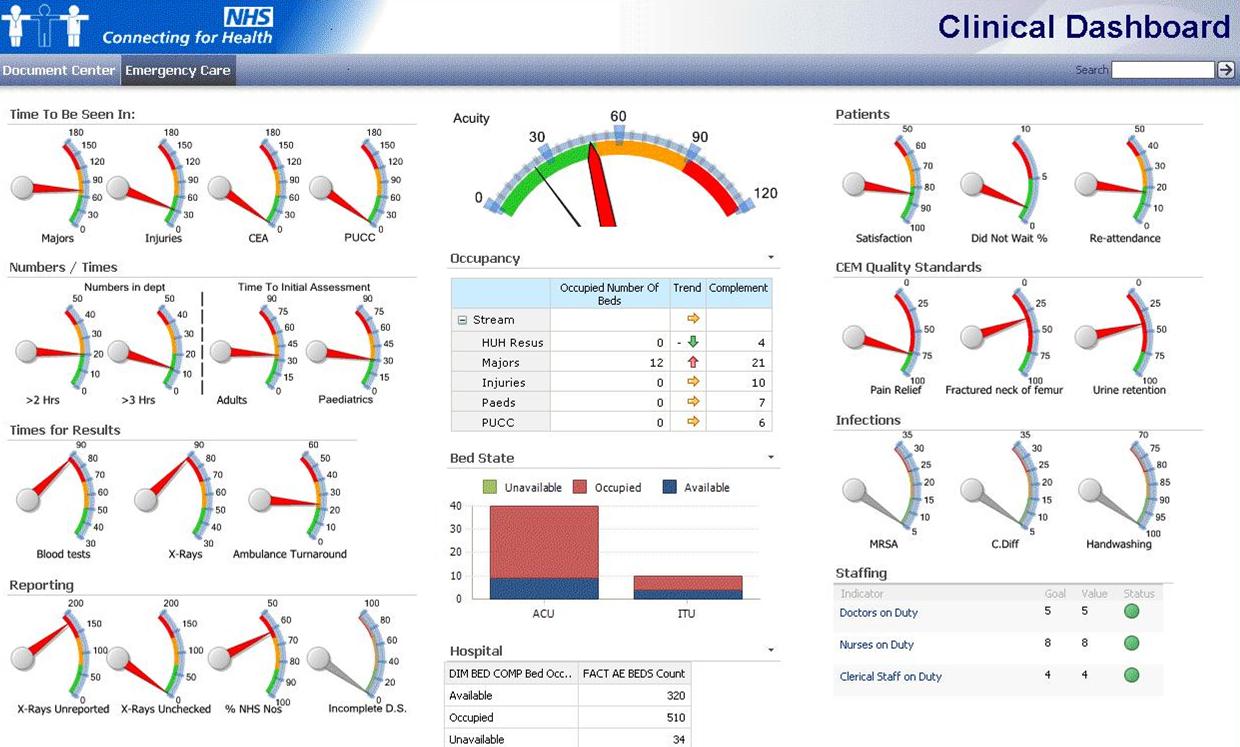
Clinical Dashboards
Clinical dashboards are designed and used in health settings to improve performance and efficiency.
-
Milton Friedman’s Dashboard
This speculative use of a dashboard shows what Milton Friedman would be looking at if he were assessing the economy through a dashboard.

-
Janet Yellen’s Dashboard
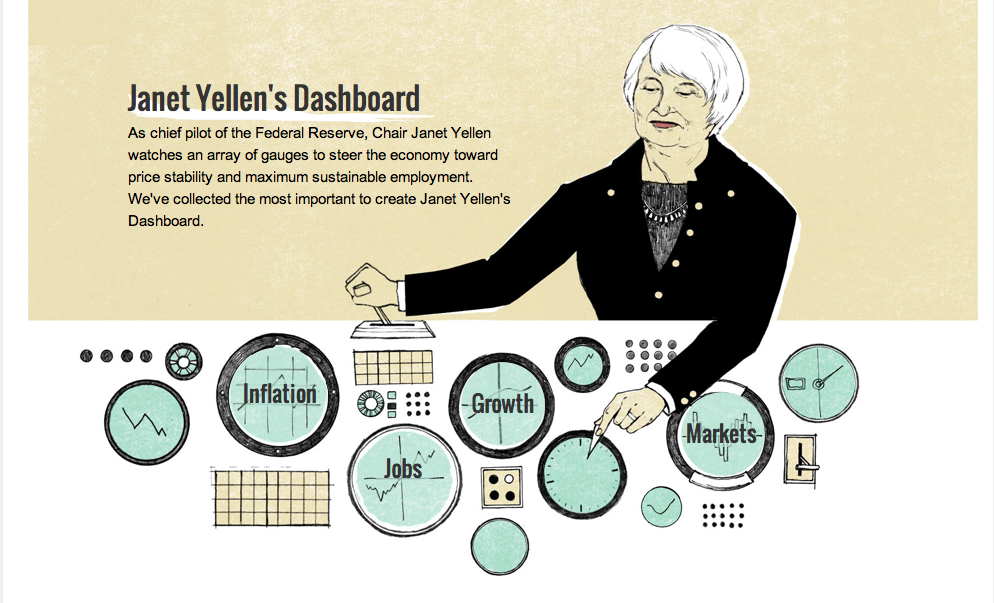
Janet Yellen's dashboard shows a dozen of the most important measures of the economy's vigor as the Fed tries to steer it toward its statutory goals of maximum sustainable employment and price stability.
-
Education Dashboard
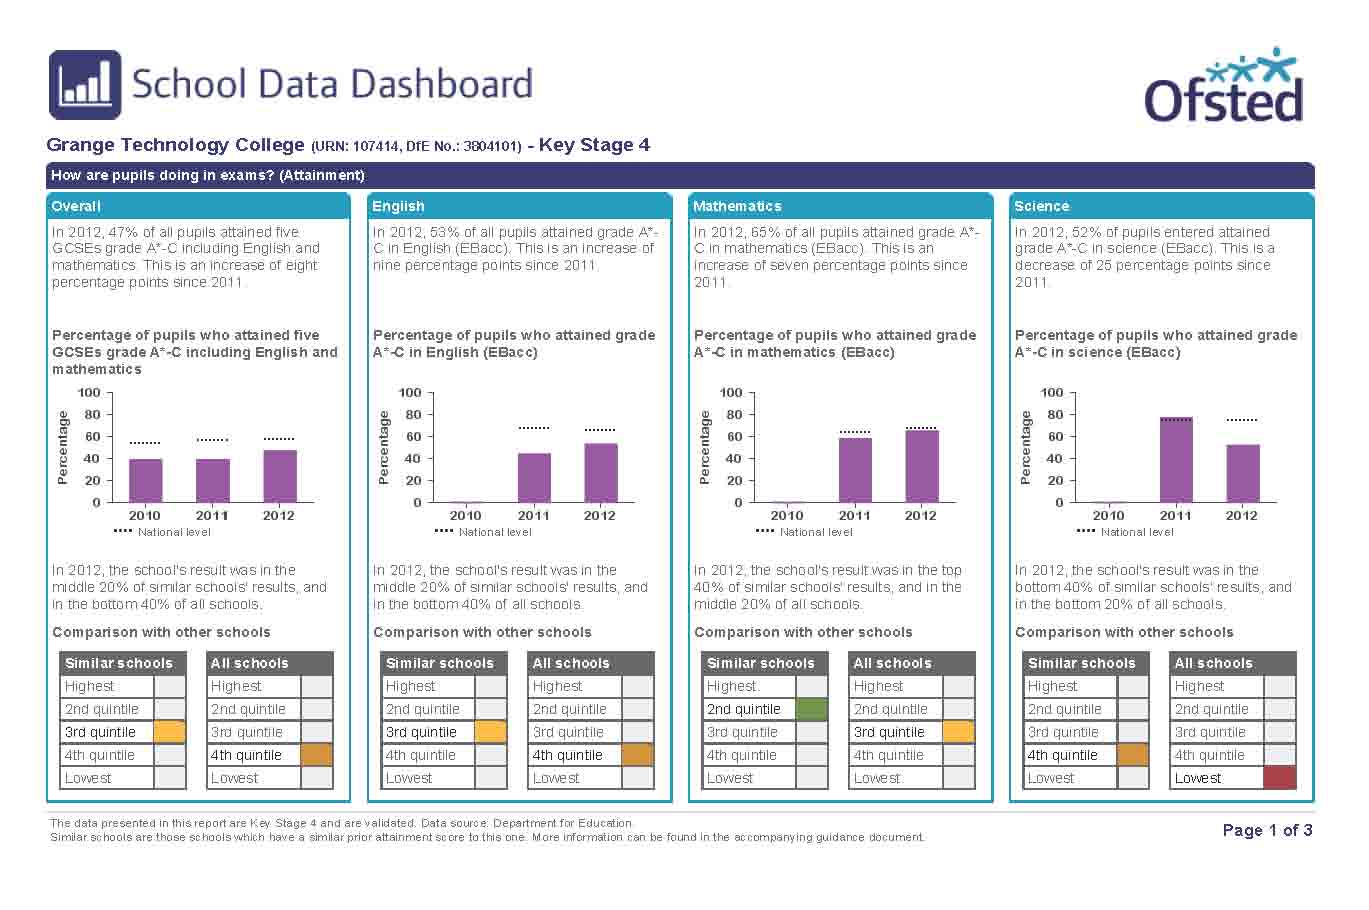
A School Data Dashboard designed by OFSTED to promote public decision making on education. OFSTED claims that 'the Data Dashboard provides a snapshot of performance in a school, college or other further education and skills providers’.
-
Chicago City Dashboard
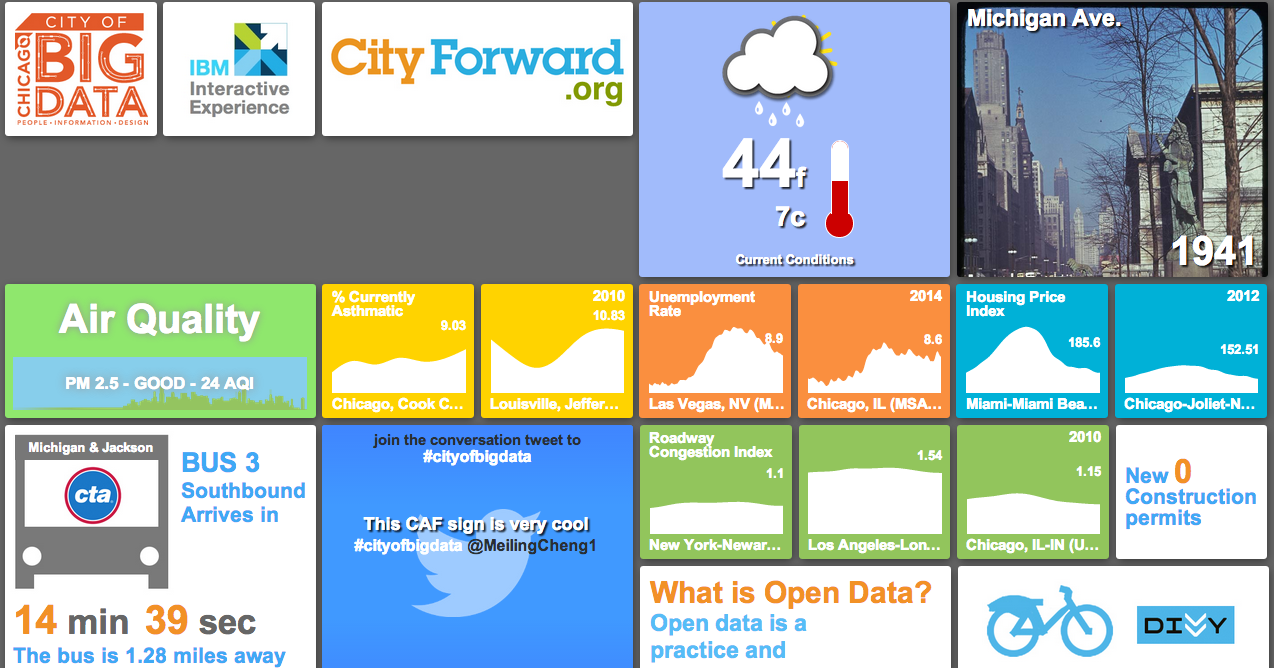
As part of the exhibition 'Chicago City of Big Data' held at the Chicago Architecture Foundation (CAF), the first Chicago's interactive dashboard was created in partnership with IBM.
-
City of Jacksonville Dashboard
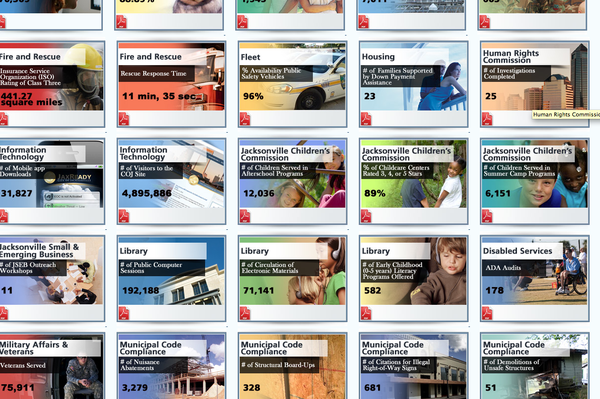
"It's almost like if you have a closed door, everyone wants to know what's going on behind it," Mohan - the city of Jacksonsville's chief information officer - said about the Dashboard in an interview with the Business Journal.
-
Crime Dashboard
The Crime Dashboard is an initiative of the Mayor of London. The interactive data dashboards make it easy for the public and stakeholders to monitor progress of the Metropolitan Police Service (MPS) against the MOPAC 202020 targets.

-
City of London Dashboard
This is the City of London's Dashboard, produced by UCL. A range of vital statistics about the City are displayed and being updated at different rates as part of the project.

-
Number 10’s Dashboard
David Cameron is said to use a bespoke dashboard displaying real-time economic data including GDP, bank lending, property prices and jobs.

-
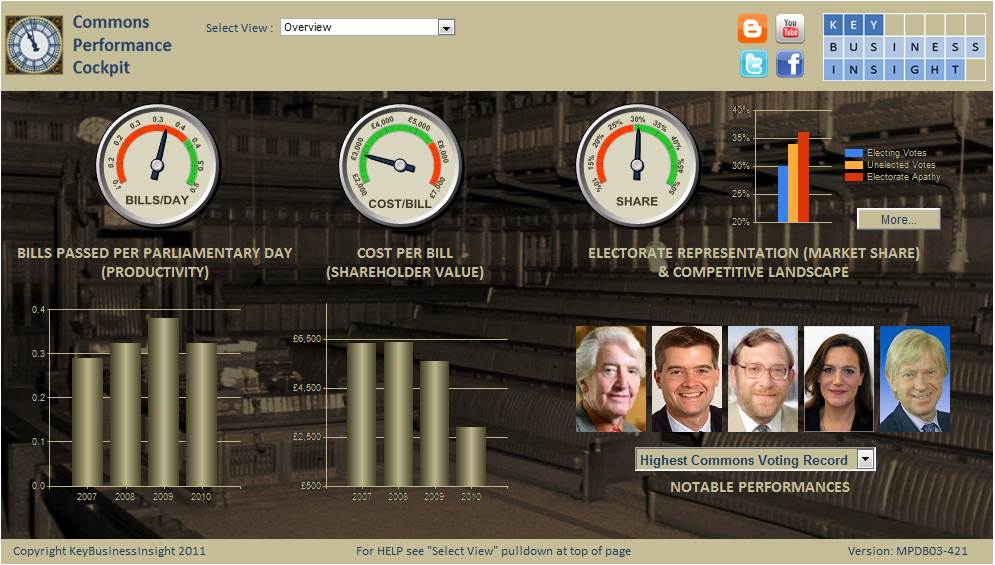
Commons Performance Cockpit
This dashboard has been designed to account for the performance of UK's House of Commons using three simple measures: Productivity, Shareholder Value and Market Share.
-
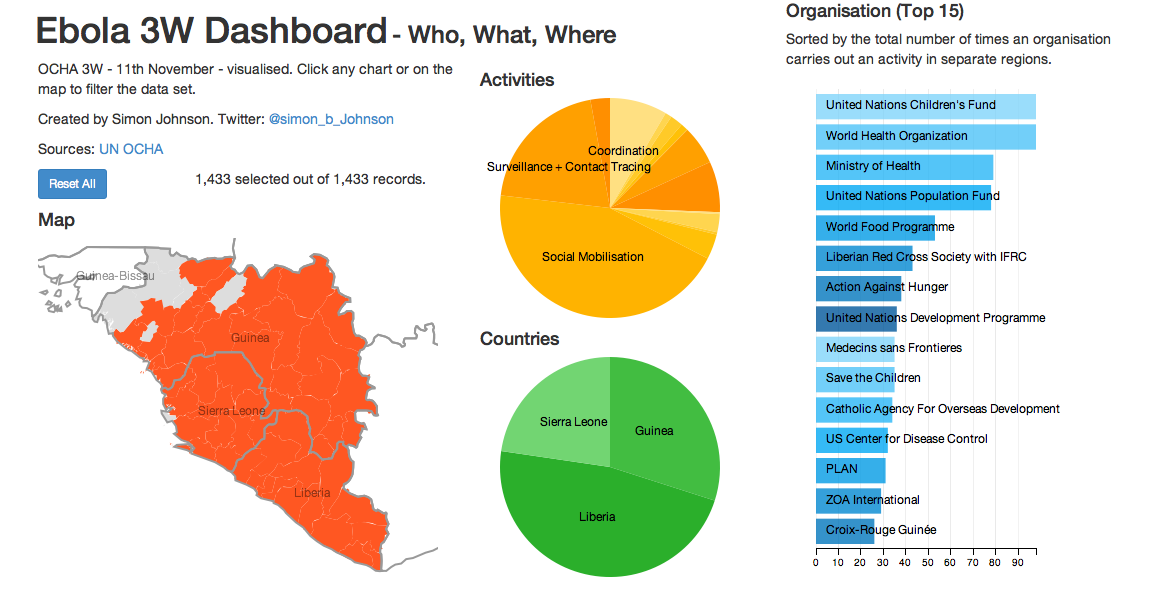
Ebola Dashboard
This is a weekly updated dashboard bringing together different datasets related to the Ebola response effort in West Africa.

Dr Nathaniel Tkacz
Dr Nathaniel Tkacz is Principal Investigator of this ESRC-funded project and Associate Professor at the Centre for Interdisciplinary Methodologies, University of Warwick. Trained in cultural and media studies, his current research draws on software studies, media theory, political economy, organisation studies and philosophy. He is author of Wikipedia and the Politics of Openness (Chicago, 2014) and co-editor of The MoneyLab Reader (forthcoming, 2015), Digital Light (OHP, 2014) and Critical Point of View: A Wikipedia Reader (INC Press, 2011). Contact Nate at n.tkacz@warwick.ac.uk

Dr Will Davies
Dr Will Davies is Co-Investigator in this project and a Senior Lecturer at Goldsmiths, University of London, where he convenes the Politics Philosophy and Economics Degree and is Co-director of the Political Economy Research Centre. He is author of The Limits of Neoliberalism: Authority, Sovereignty and the Logic of Competition (Sage, 2014). His research is in economic sociology, political economy and the history of economics. He is author of a book on happiness measurement, to be published by Verso in 2015.
Contact Will at w.davies@gold.ac.uk

Dr. Ana Gross
Dr. Ana Gross is the Research Fellow for the project. Ana completed her PhD at the Centre for Interdisciplinary Methodologies at the University of Warwick and was also a Visiting Doctoral Student at the Centre for the Study of Invention and Social Process at Goldsmiths College, University of London. Her PhD thesis explored data leaks and the repurposing of data for the identification of persons and things in everyday settings. Ana has published on the subjects of data activisms and data anonymisation. Contact Ana at Ana.Gross@warwick.ac.uk
Who We Are
Sed consequat felis a nunc feugiat semper. Sed a laoreet orci, a placerat dui. Nulla massa lectus, sollicitudin quis sodales at, tincidunt id justo.
Mission
Nulla massa lectus, sollicitudin quis sodales at, tincidunt id justo. Sed consequat felis a nunc feugiat semper. Sed a laoreet orci, a placerat dui.
Vision
Sed consequat felis a nunc feugiat semper. Sed a laoreet orci, a placerat dui. Nulla massa lectus, sollicitudin quis sodales at, tincidunt id justo.
TALKS

Dr Nathaniel Tkacz
Dr Nathaniel Tkacz is Principal Investigator of this ESRC-funded project and Associate Professor at the Centre for Interdisciplinary Methodologies, University of Warwick. Trained in cultural and media studies, his current research draws on software studies, media theory, political economy, organisation studies and philosophy. He is author of Wikipedia and the Politics of Openness (Chicago, 2014) and co-editor of The MoneyLab Reader (forthcoming, 2015), Digital Light (OHP, 2014) and Critical Point of View: A Wikipedia Reader (INC Press, 2011). Contact Nate at n.tkacz@warwick.ac.uk

Dr Will Davies
Dr Will Davies is Co-Investigator in this project and a Senior Lecturer at Goldsmiths, University of London, where he convenes the Politics Philosophy and Economics Degree and is Co-director of the Political Economy Research Centre. He is author of The Limits of Neoliberalism: Authority, Sovereignty and the Logic of Competition (Sage, 2014). His research is in economic sociology, political economy and the history of economics. He is author of a book on happiness measurement, to be published by Verso in 2015.
Contact Will at w.davies@gold.ac.uk

Dr. Ana Gross
Dr. Ana Gross is the Research Fellow for the project. Ana completed her PhD at the Centre for Interdisciplinary Methodologies at the University of Warwick and was also a Visiting Doctoral Student at the Centre for the Study of Invention and Social Process at Goldsmiths College, University of London. Her PhD thesis explored data leaks and the repurposing of data for the identification of persons and things in everyday settings. Ana has published on the subjects of data activisms and data anonymisation. Contact Ana at Ana.Gross@warwick.ac.uk
Plans For Everybody
bibendum. Pellentesque iaculis sagittis lorem. Nulla facilisi. Integer elementum fringilla consectetur. Nullam volutpat, metus tempus semper lobortis, diam urna commodo urna, nec auctor tortor sapien mollis nunc. Pellentesque rutrum lacinia porttitor. Quisque sit amet mauris nisl. Praesent arcu turpis, blandit non semper elementum, malesuada iaculis dolor.
Explore the portfolio to check out amazing work
Our Best Projects and Case Studies
bibendum. Pellentesque iaculis sagittis lorem. Nulla facilisi. Integer elementum fringilla consectetur. Nullam volutpat, metus tempus semper lobortis, diam urna commodo urna, nec auctor tortor sapien mollis nunc. Pellentesque rutrum lacinia porttitor. Quisque sit amet mauris nisl. Praesent arcu turpis, blandit non semper elementum, malesuada iaculis dolor.
-
Internet Live Stats
A dashboard showing real time data of internet usage

-
National Grid Monitoring
A dashboard monitoring the UK's national energy consumption and electrical grid status.

-
Real Time Energy Dashboards
Real-time energy consumption dashboards are being publicly displayed in a range of organisations.

-
Birmingham Civic Dashboard
A dashboard accounting for the service delivery of Birmingham City Council

-
Privacy Dashboard
Google as well as some newly developed add-ons enable users to oversee the private information held in their accounts in a dashboard format.

-
Democratic Dashboard
A website enabling citizens to acquire and organise a range of information to inform their decisions regarding the next General Election in the UK.

-
Wellbeing Dashboard
The Office of National Statistics in the UK has recently started publishing GDP figures as part of a wellbeing dashboard comprising a set of seven additional indicators.

-
Disaster Dashboard
A dashboard has been developed according to techwire in partnership between San Francsico's City Department of Health and civic tech company Appallicious to help the city prepare and recover from natural disasters.

-
Clinical Dashboards
Clinical dashboards are designed and used in health settings to improve performance and efficiency.

-
Milton Friedman’s Dashboard
This speculative use of a dashboard shows what Milton Friedman would be looking at if he were assessing the economy through a dashboard.

-
Janet Yellen’s Dashboard
Janet Yellen's dashboard shows a dozen of the most important measures of the economy's vigor as the Fed tries to steer it toward its statutory goals of maximum sustainable employment and price stability.

-
Education Dashboard
A School Data Dashboard designed by OFSTED to promote public decision making on education. OFSTED claims that 'the Data Dashboard provides a snapshot of performance in a school, college or other further education and skills providers’.

-
Chicago City Dashboard
As part of the exhibition 'Chicago City of Big Data' held at the Chicago Architecture Foundation (CAF), the first Chicago's interactive dashboard was created in partnership with IBM.

-
City of Jacksonville Dashboard
"It's almost like if you have a closed door, everyone wants to know what's going on behind it," Mohan - the city of Jacksonsville's chief information officer - said about the Dashboard in an interview with the Business Journal.

-
Crime Dashboard
The Crime Dashboard is an initiative of the Mayor of London. The interactive data dashboards make it easy for the public and stakeholders to monitor progress of the Metropolitan Police Service (MPS) against the MOPAC 202020 targets.

-
City of London Dashboard
This is the City of London's Dashboard, produced by UCL. A range of vital statistics about the City are displayed and being updated at different rates as part of the project.

-
Number 10’s Dashboard
David Cameron is said to use a bespoke dashboard displaying real-time economic data including GDP, bank lending, property prices and jobs.

-
Commons Performance Cockpit
This dashboard has been designed to account for the performance of UK's House of Commons using three simple measures: Productivity, Shareholder Value and Market Share.

-
Ebola Dashboard
This is a weekly updated dashboard bringing together different datasets related to the Ebola response effort in West Africa.

Pellentesque et tincidunt velit, eget consequat mi. Sed eu suscipit dui. Mauris in odio tempor, placerat lectus sit amet, volutpat ante. Etiam lacinia dictum imperdiet. Class aptent taciti sociosqu ad litora torquent per conubia nostra, per inceptos himenaeos. Suspendisse tristique sapien non orci ultrices, id porttitor tellus pellentesque. Interdum et malesuada fames ac ante ipsum primis in faucibus
Read the News About us
bibendum. Pellentesque iaculis sagittis lorem. Nulla facilisi. Integer elementum fringilla consectetur. Nullam volutpat, metus tempus semper lobortis, diam urna commodo urna, nec auctor tortor sapien mollis nunc. Pellentesque rutrum lacinia porttitor. Quisque sit amet mauris nisl. Praesent arcu turpis, blandit non semper elementum, malesuada iaculis dolor.
support@sktthemes.com
+123 456 7890
Call or Drop us an Email
bibendum. Pellentesque iaculis sagittis lorem. Nulla facilisi. Integer elementum fringilla consectetur. Nullam volutpat, metus tempus semper lobortis, diam urna commodo urna, nec auctor tortor sapien mollis nunc. Pellentesque rutrum lacinia porttitor. Quisque sit amet mauris nisl. Praesent arcu turpis, blandit non semper elementum, malesuada iaculis dolor.
University of Warwick


