From 7-11 September, the team undertook the official launch of this innovation initiative in Praia, Cabo Verde.
The week included an initial training on the “integrated methodology and visual analytics” approach for national stakehodlers, which will be the methodology that underpins the research of this initiative, and discussion on how to design the visual platform.
The week-long training was hosted by UNDP Cabo Verde, part of the one UN Joint office, in collaboration with the University of Cabo Verde (UniCV) who will be the local research partner for this innovation initiative. In addition to the national partners, the international resource people supporting the mission included:
Jerri Husch, global research coordinator and expert in the “integrated method and visual analytics” (IMVA) methodology being used for this initiative – associated with the University of Warwick.
Simao Belchior, project manager at Vizzuality, the technology company hired to support the development of the platform.
The training was conducted primarily for the core researchers from the UniCV’s Escola Superior de Ciencias Agrarias e Ambiente (School of Agricultural and Environmental Science); however, was also joined by several other partners and stakeholders of the project, including: the Ministry of Rural Development (implementing partner for the national adaptation projects supported by the Government of Canada), the National Institute for Agricultural Research and Development (INIDA), the Instituto Nacional da Gestao do Terrirotiro (National Institute of Land Management), and the Centro de Investigacao em Genero e Familia (Gender and Family Research Institute at UniCV). These partners will be crucial to accessing the right data for analysis, and also ensuring sustainability and ownership at the national level in the future.
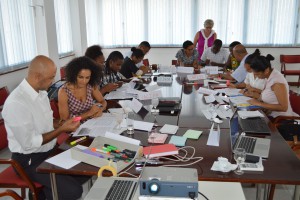
The training consisted of building skills on the IMVA, and then applying them in the field.
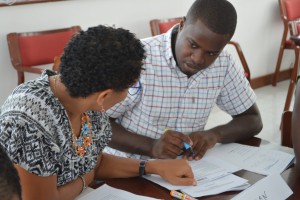
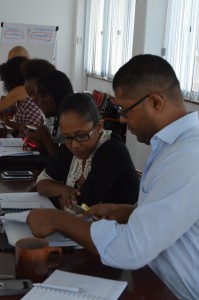
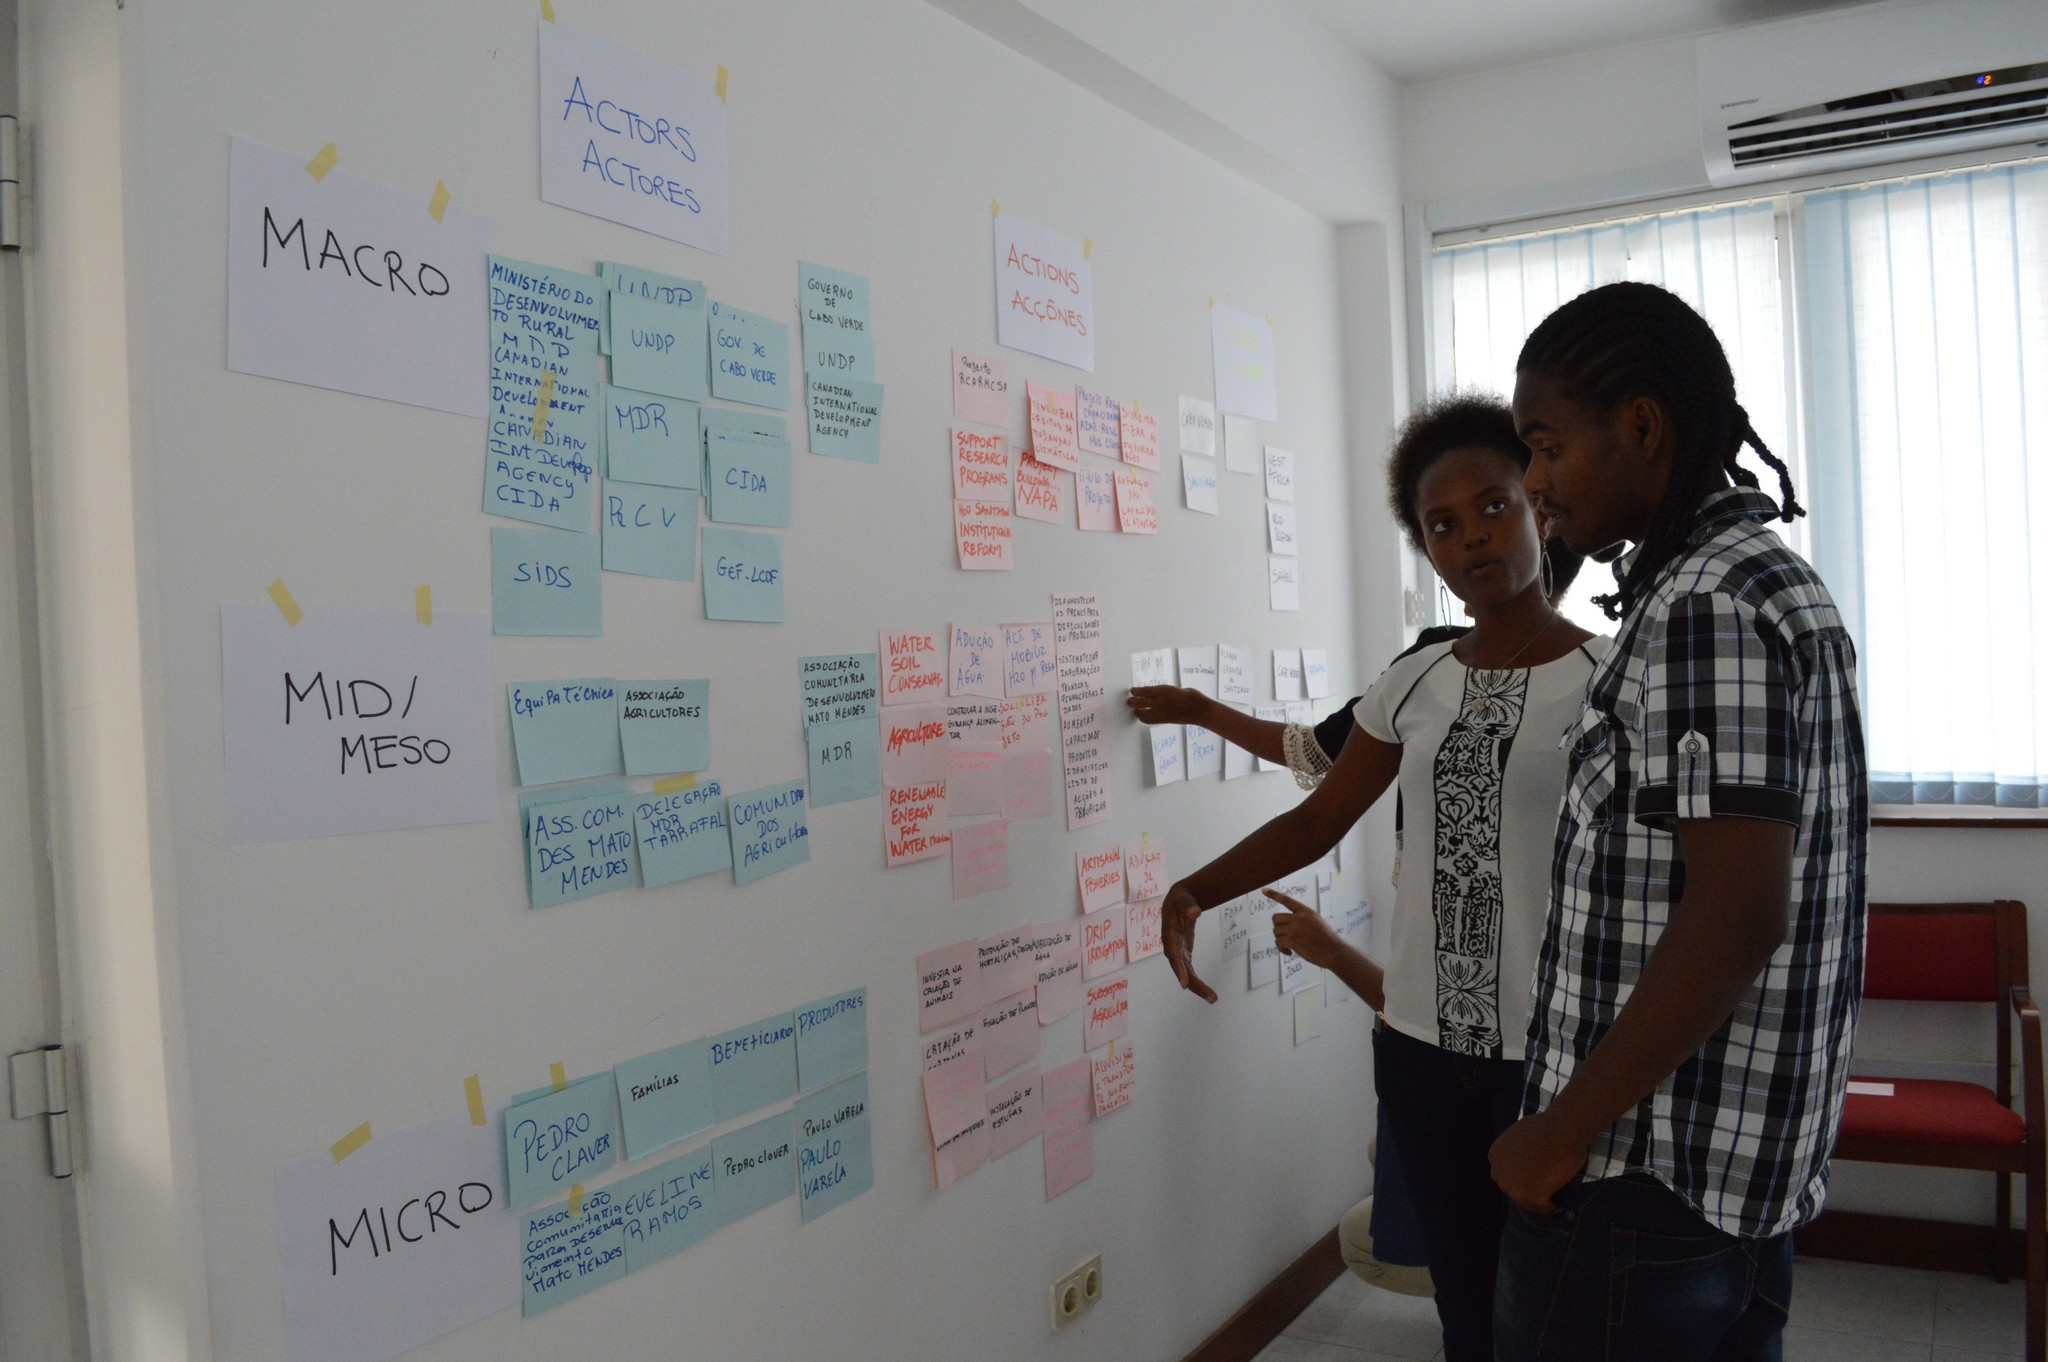
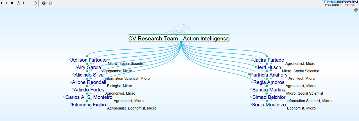
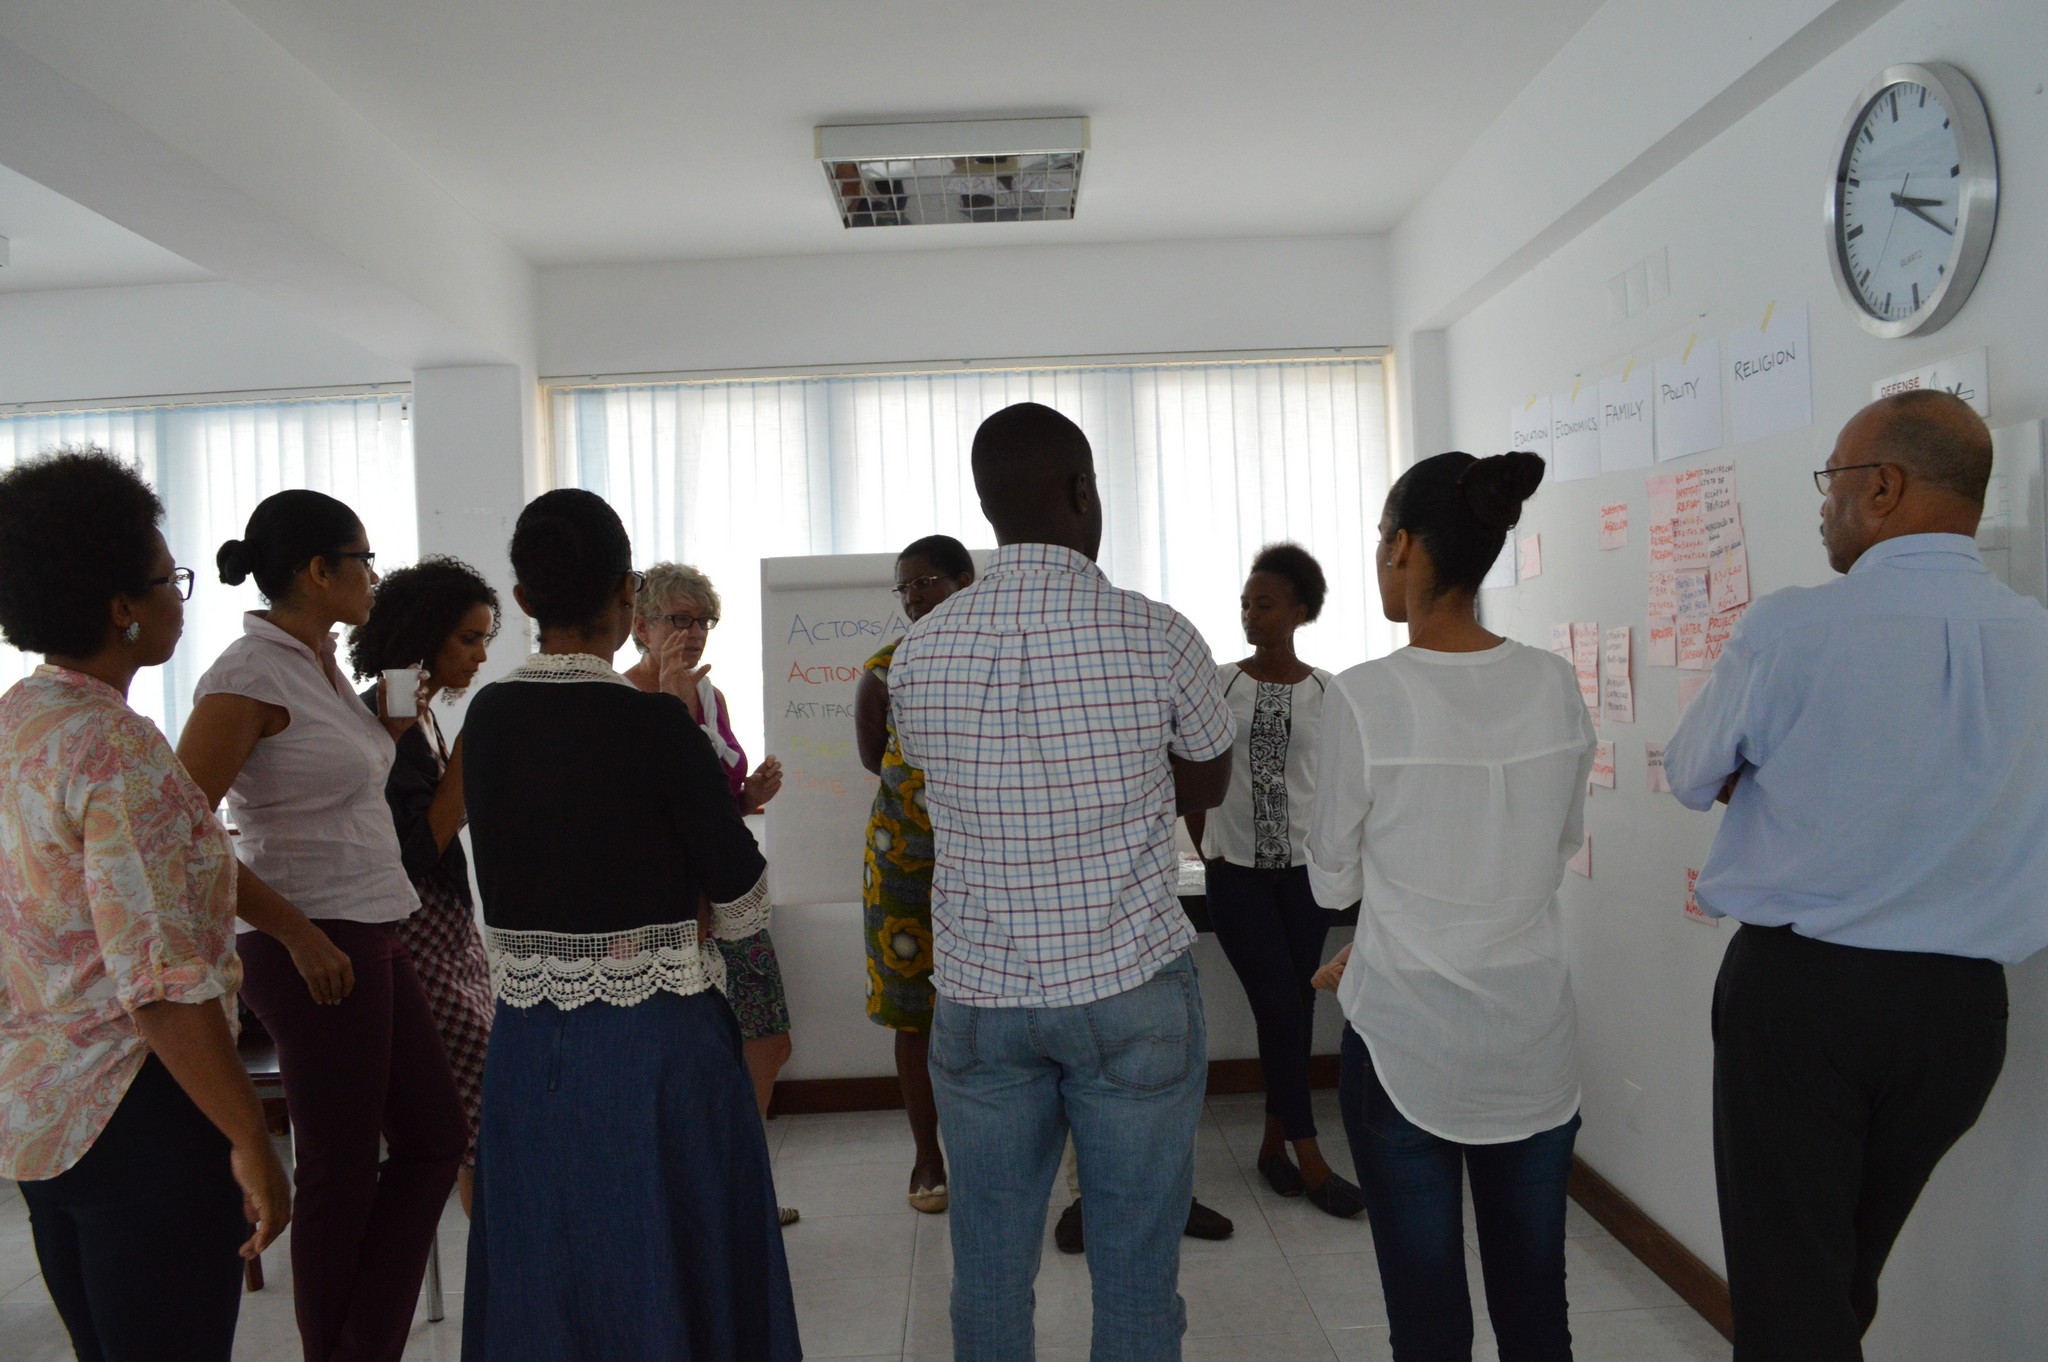
First, the participants were introduced to basic qualitative methods, and the common ontology which will be used with this methodology. This ontology includes a basic coding of data according to five components: Actor, Action, Artifact, Time and Place, or the “AAAPT” model. This allows analysts to capture data from all types of sources – quantitative and qualitative, as well as structured and unstructured. The participants then practiced applying this taxonomy by going through project documents from the climate change adaptation project and extracting Actors and Actions.

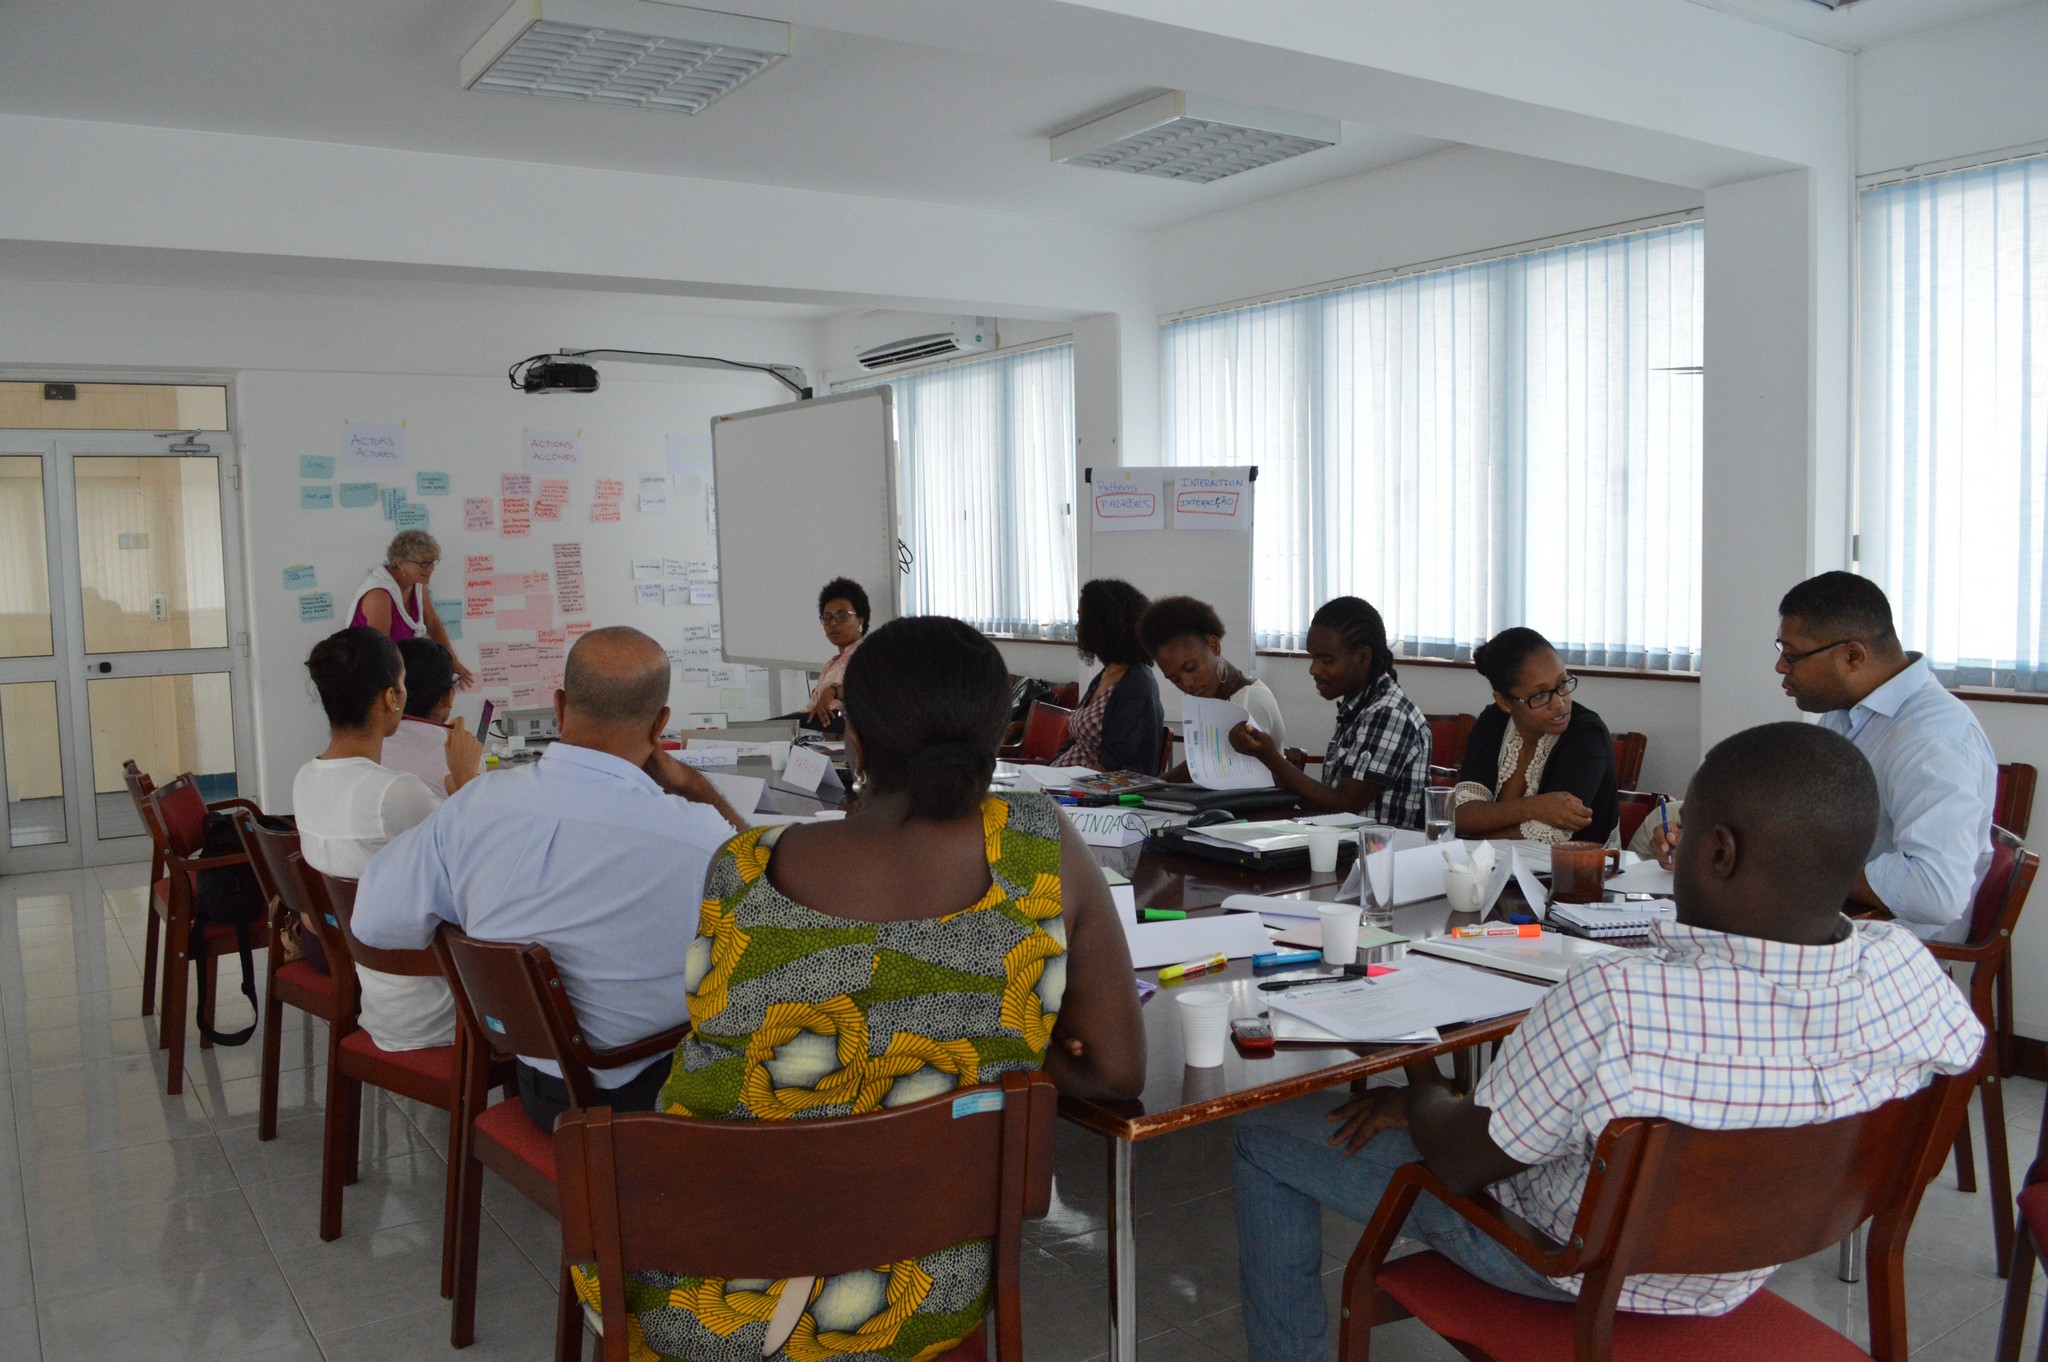
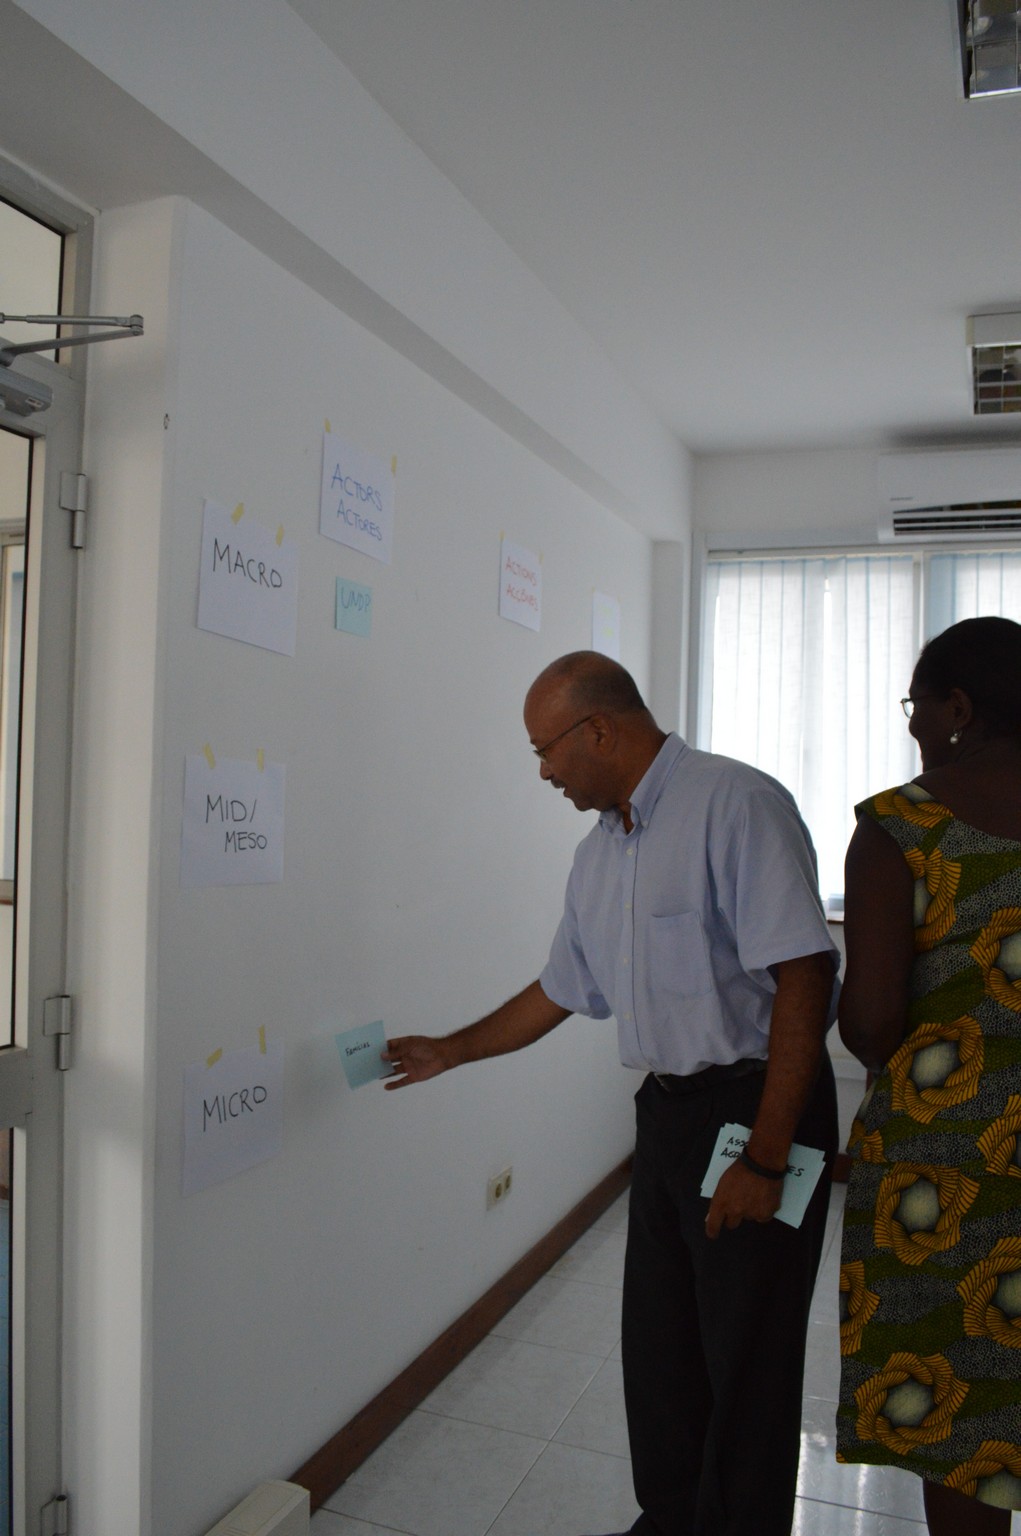
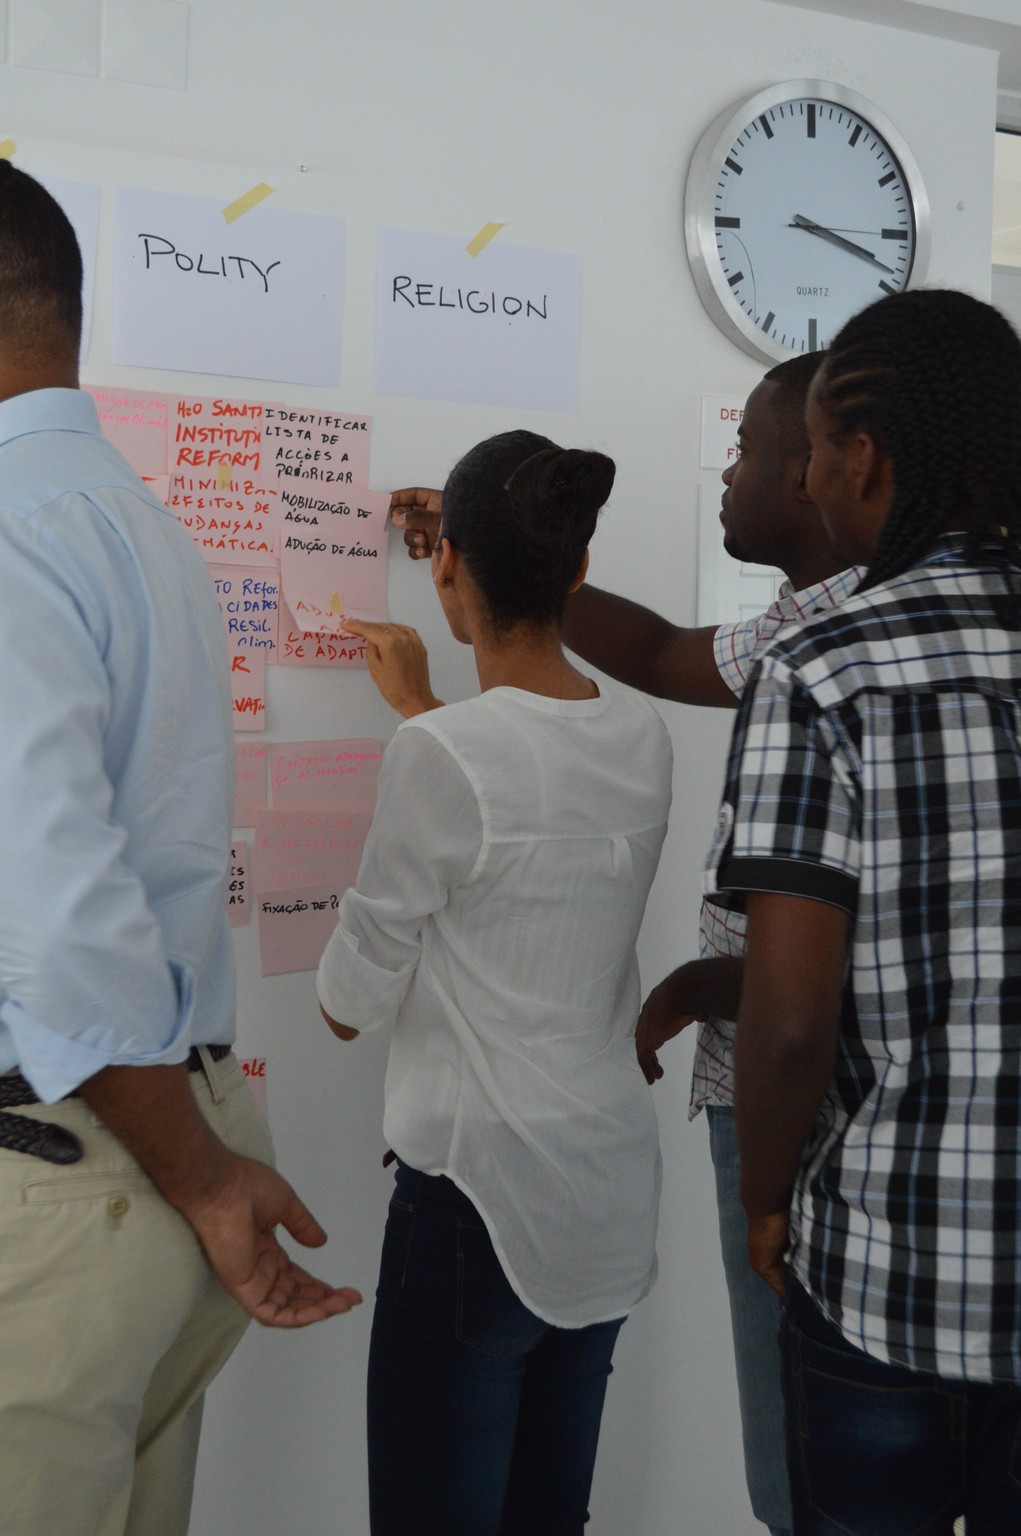
Next, the participants were introduced to the overarching taxonomy that will allow for categorizing all of the captured data. This taxonomy starts with a distinction between “micro,” “mid/meso,” and “macro” levels. To practice this, participants took the data they extracted from the project documents, wrote them on index cards, and organized them according to these three levels on the wall.
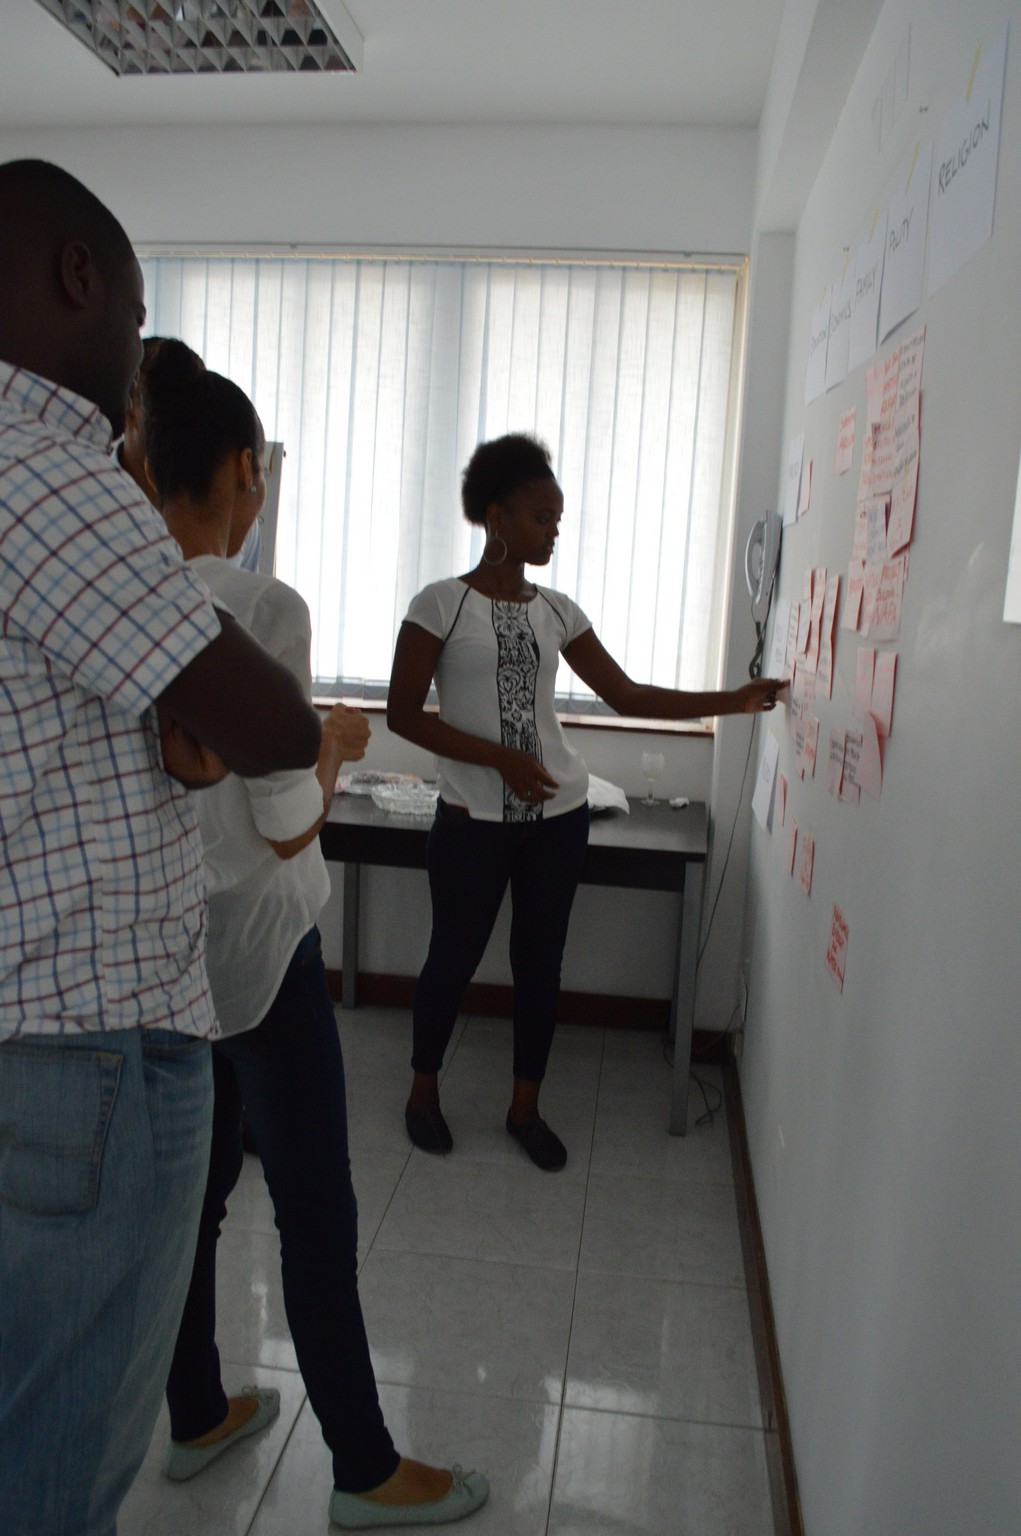
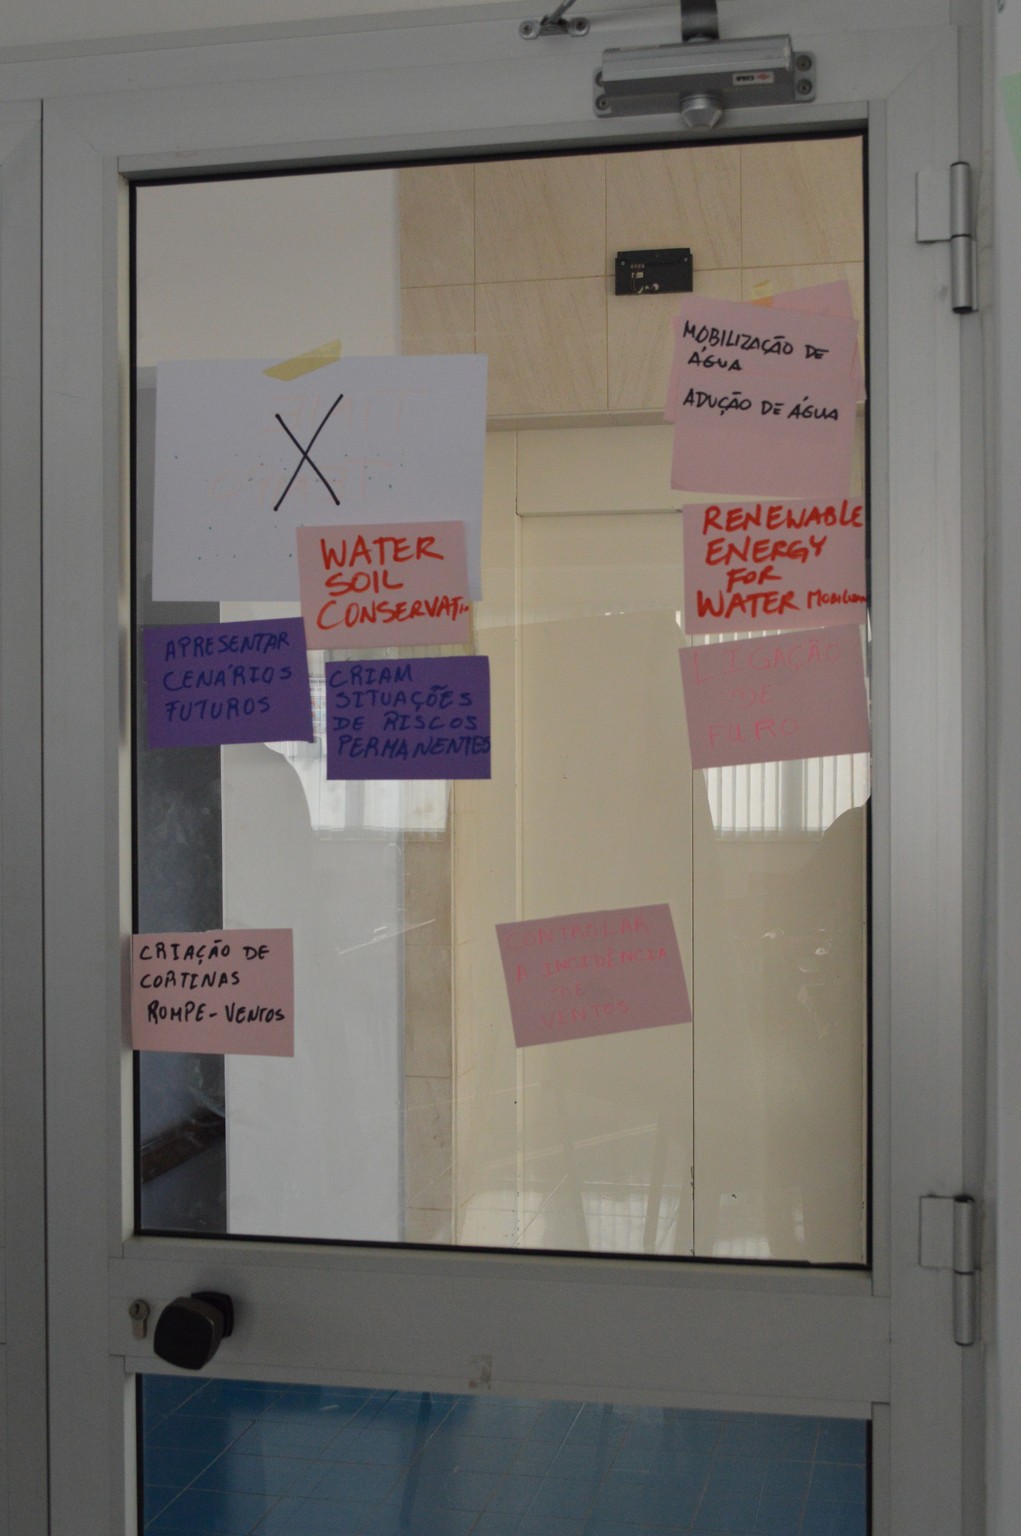
The second element of the taxonomy is the five domains – founded in sociology, these five domains are inherent in ALL societies, though in different forms and different priorities. These domains include: Economy, Education, Family, Polity and Religion. The participants then transferred all of the data they collected and organized them along these five domains, keeping the three levels intact – creating a 3 x 5 matrix.
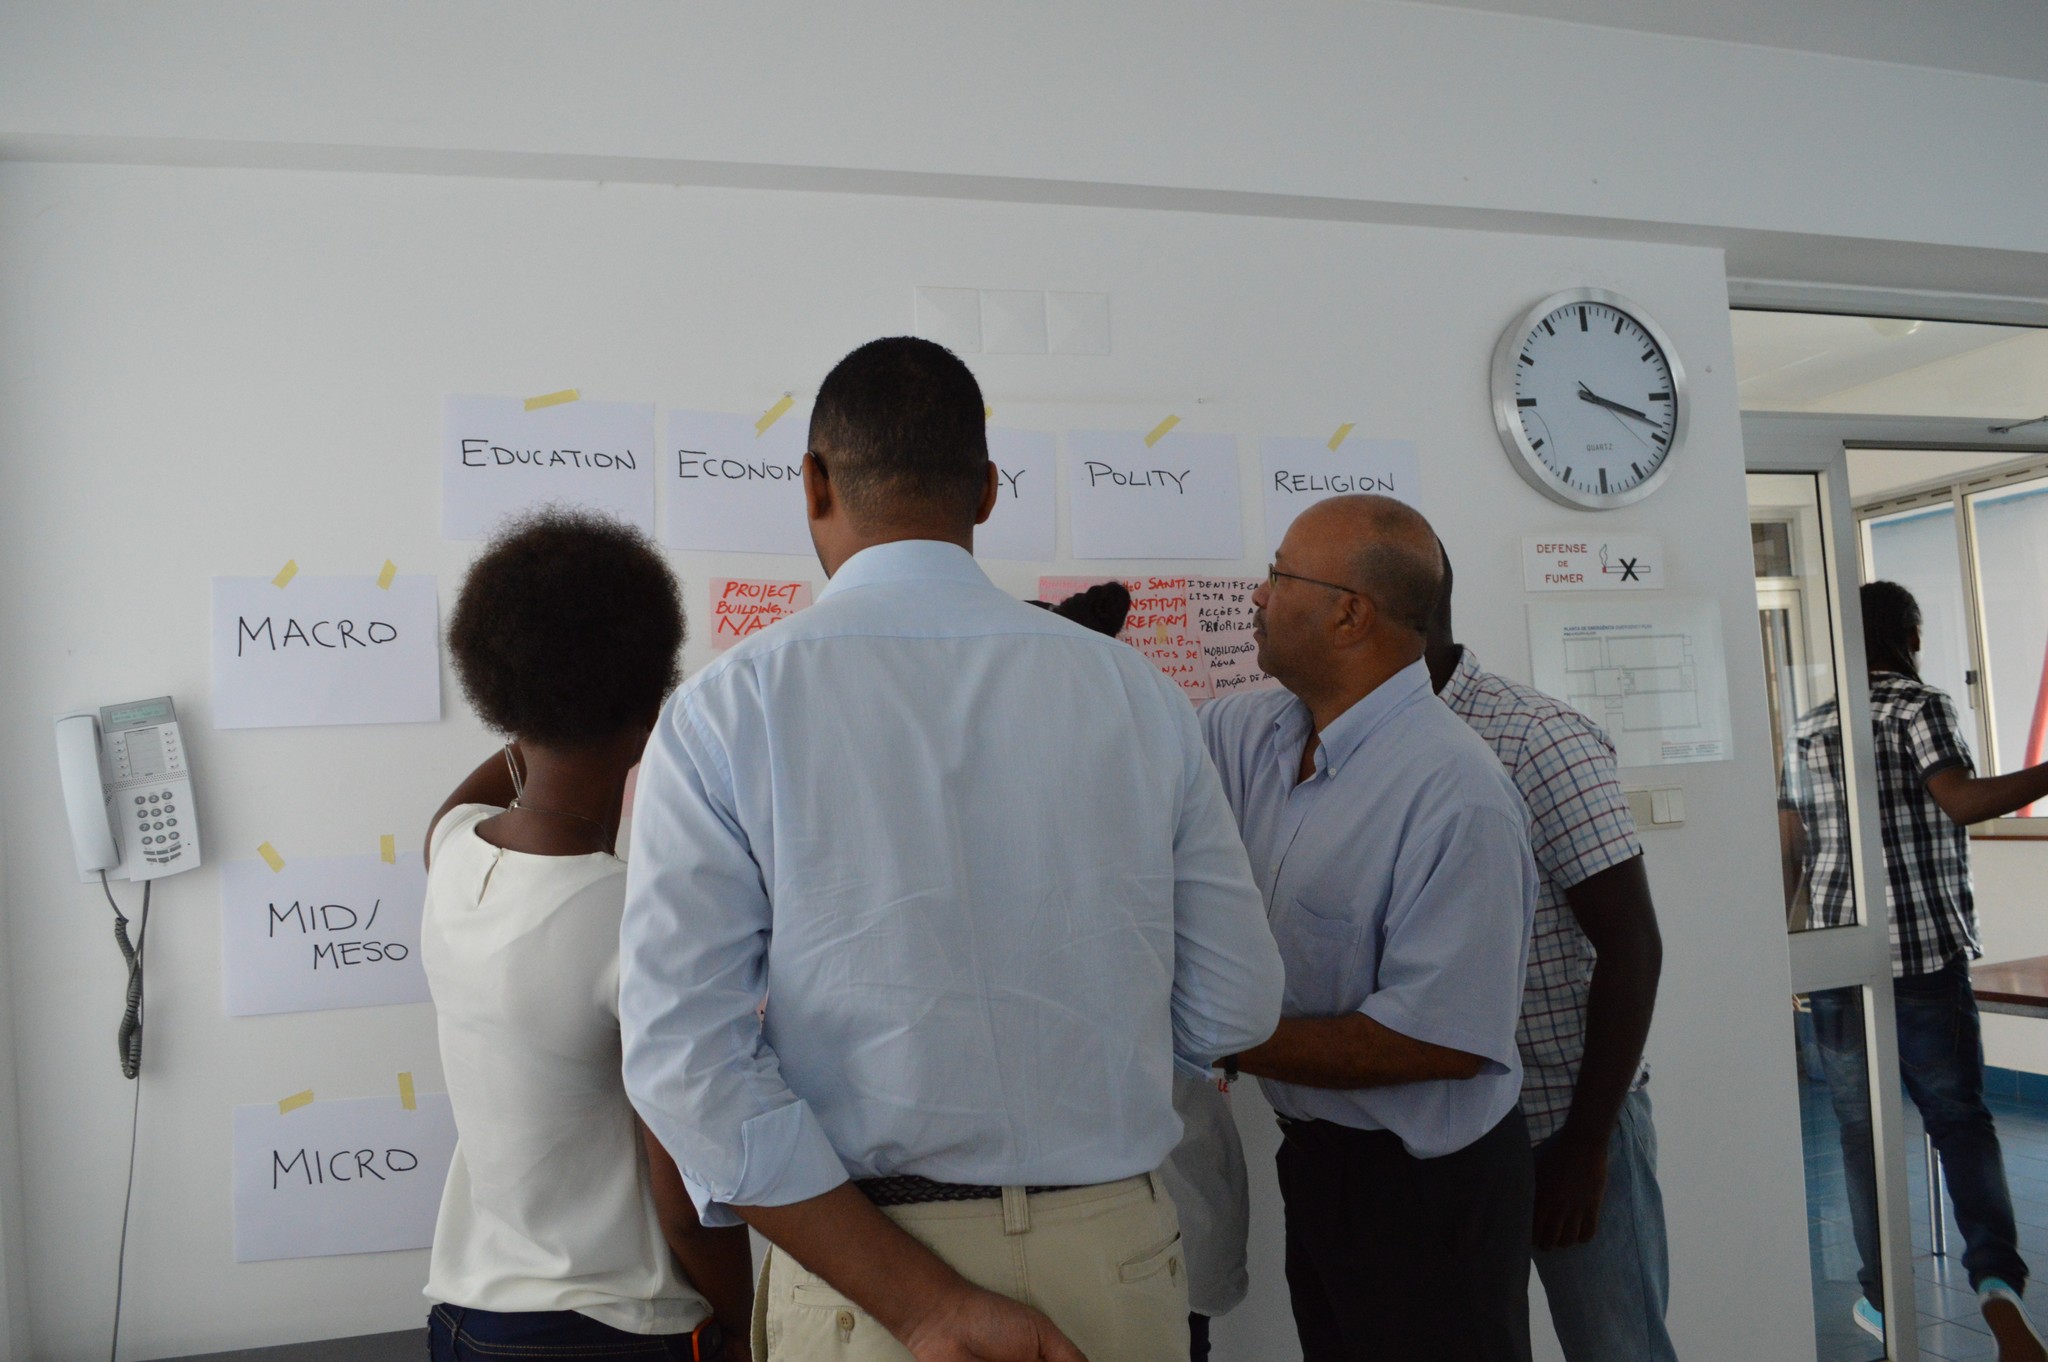
In addition, a separate “X” domain was created, which represents the derivatives of the five domains, for example including Agriculture, Energy, Transportation, Health, etc.
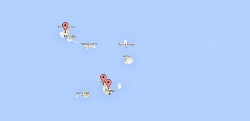
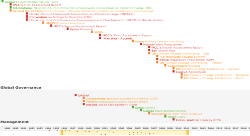
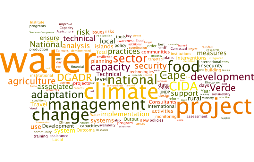
With a solid understanding of the ontology, coding and taxonomy for organizing data, the participants were introduced to how to analyze and make sense of this organized data. Several perspectives were introduced which have been used in the past to examine the data according to geography (on maps), time (over a timeline), network (through social-network analysis) and content (through tag clouds). However, these types of tools will be directly integrated into the new visualization tool that is being developed under this innovation initiative. However, using these open source tools allowed the participants to start seeing patterns, trends and hidden insights about the data.
Finally, with an understanding of how to organize data, and the use of visual tools to analyze and make sense of the information, the participants applied this methodology in the field.
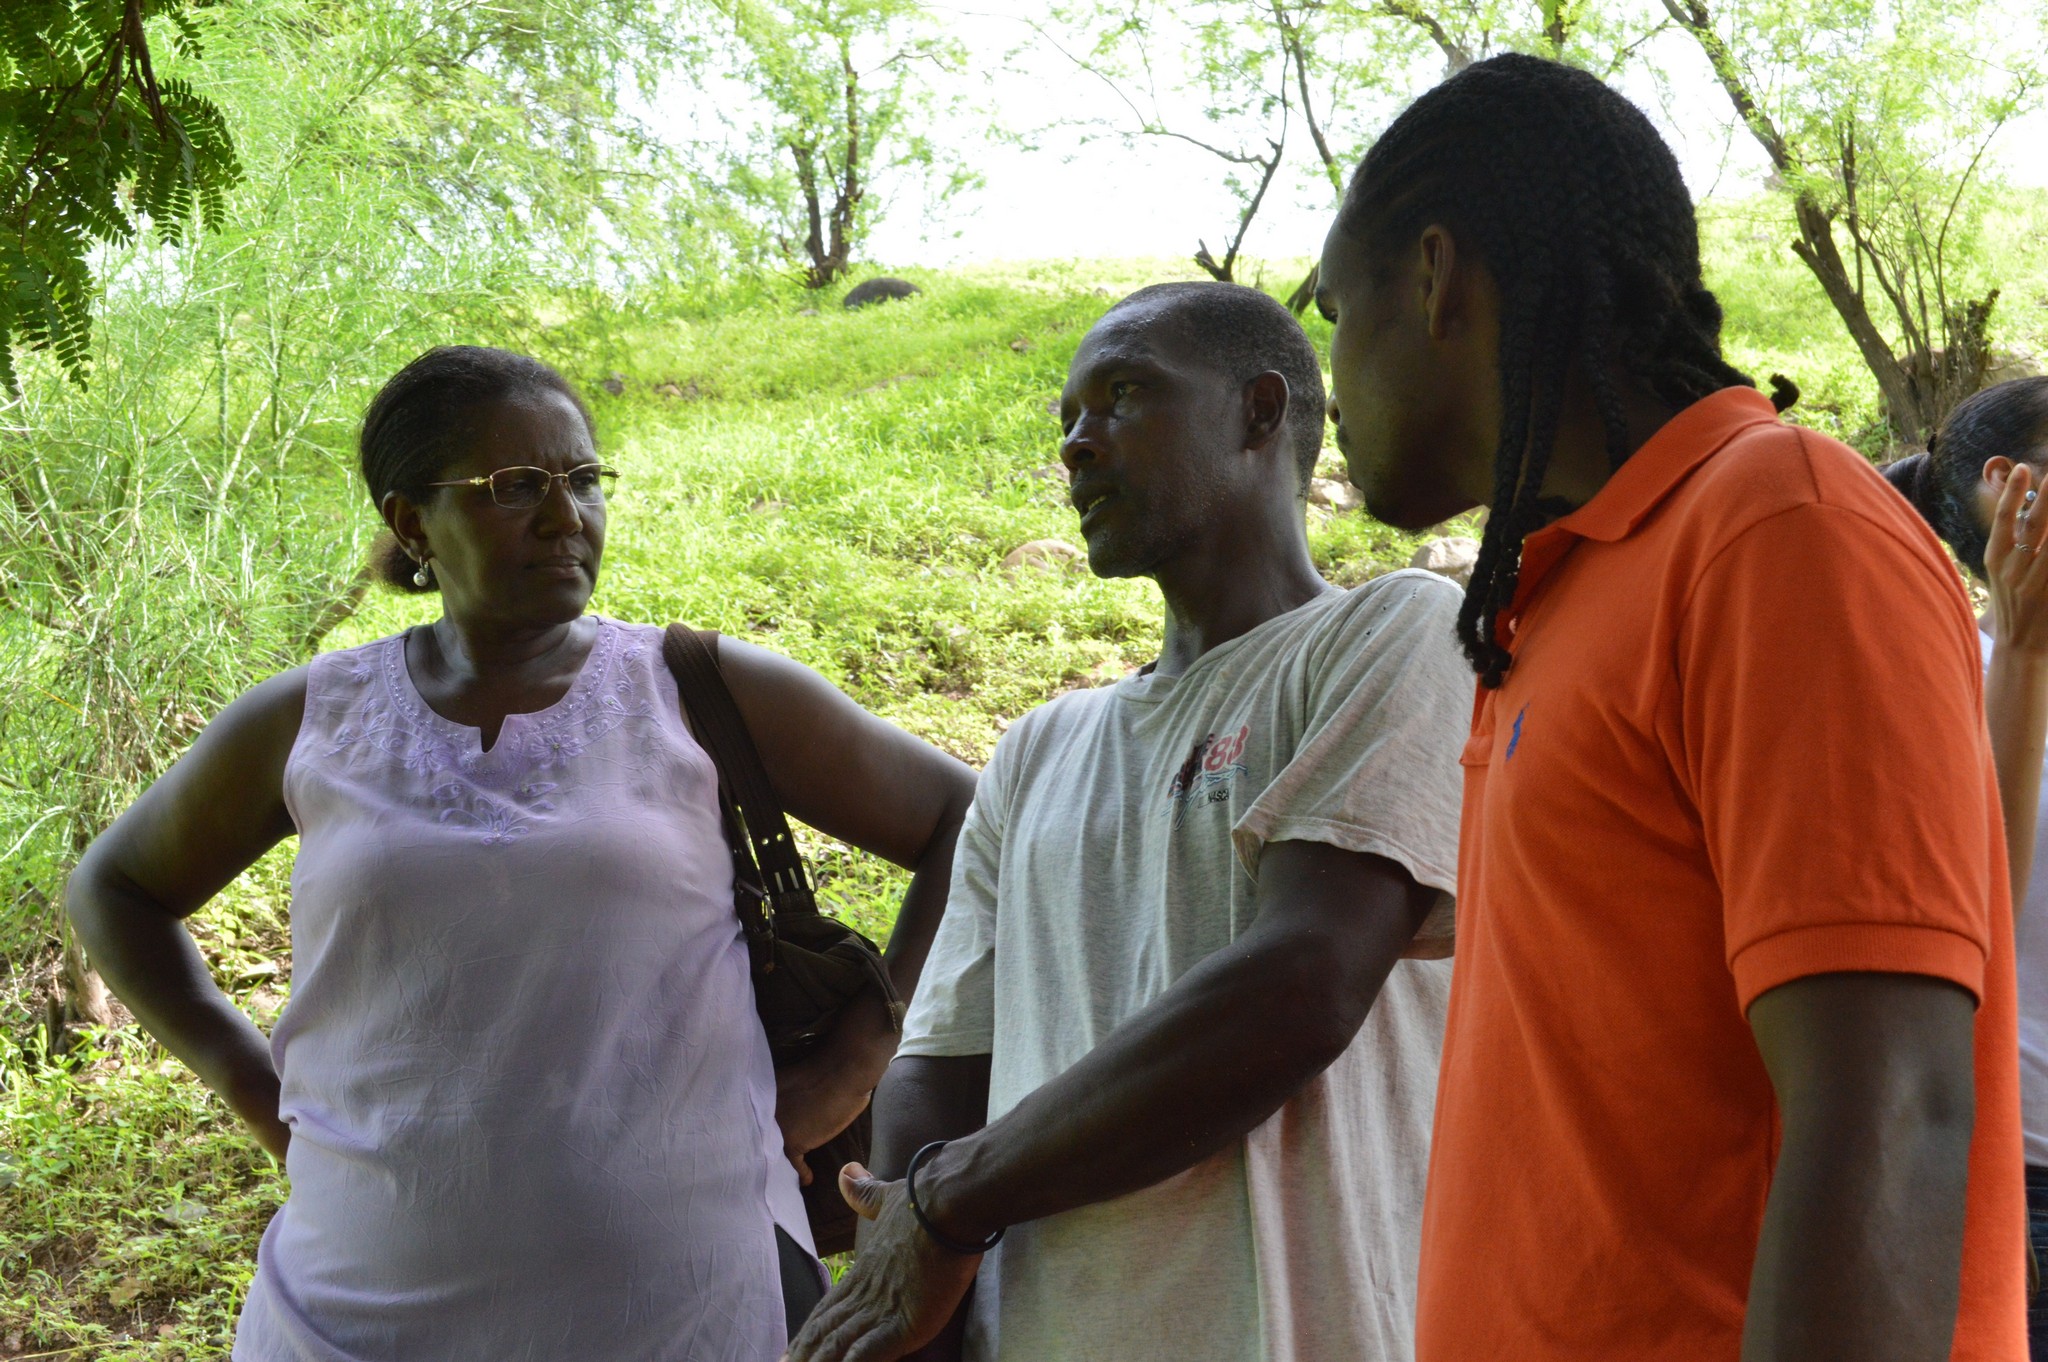
Participants took a full day field trip to three project demonstration sites in Santiago Island. During the trip, participants undertook qualitative interviews with project beneficiaries to extract data and information which could be used to better analyze the context surrounding each initiative – to assess what was successful and why. They met with a farmer, Manuel, who was introducing new climate-resilient crops
…a community which was rehabilitating a fish processing plant using solar power
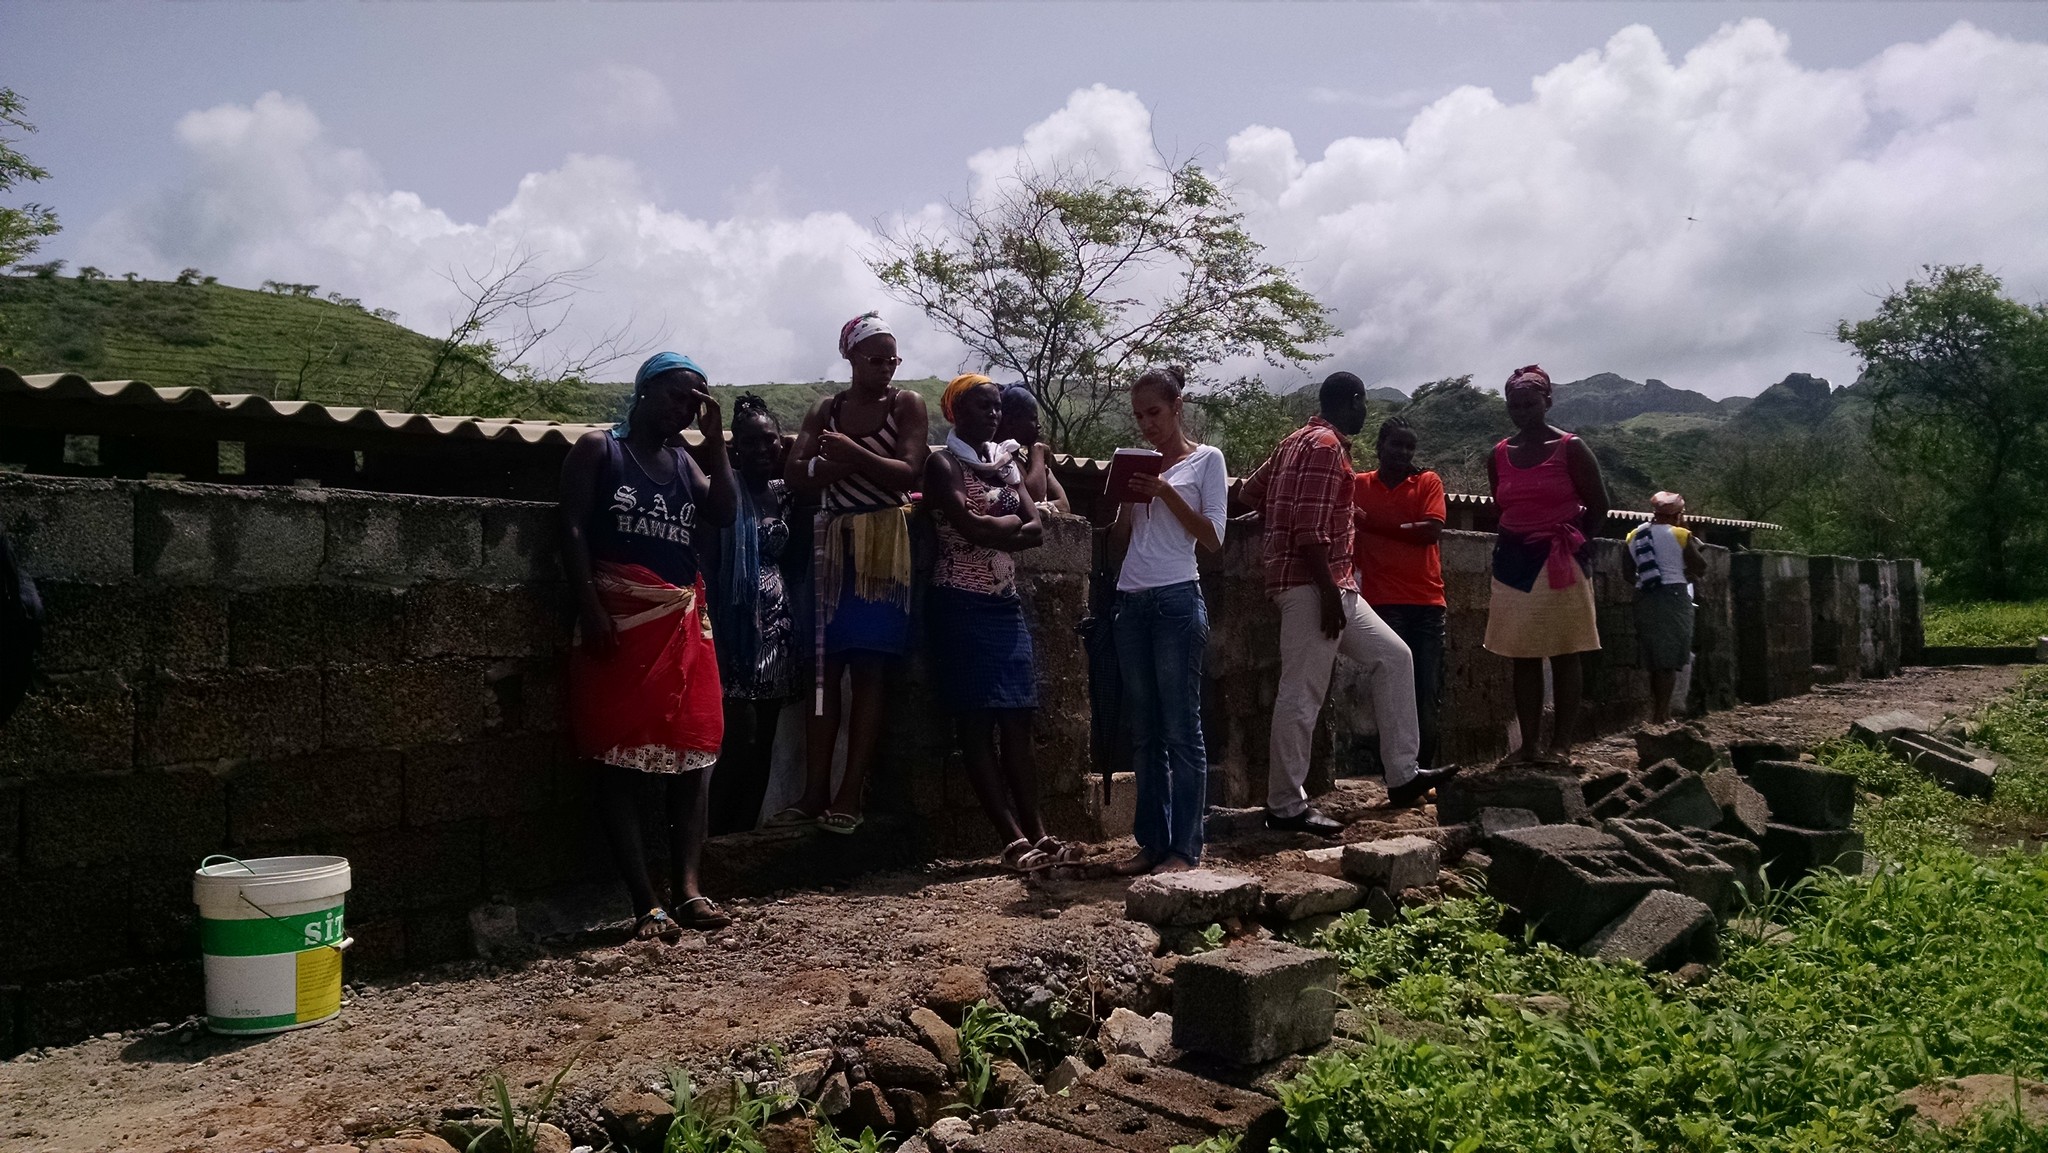
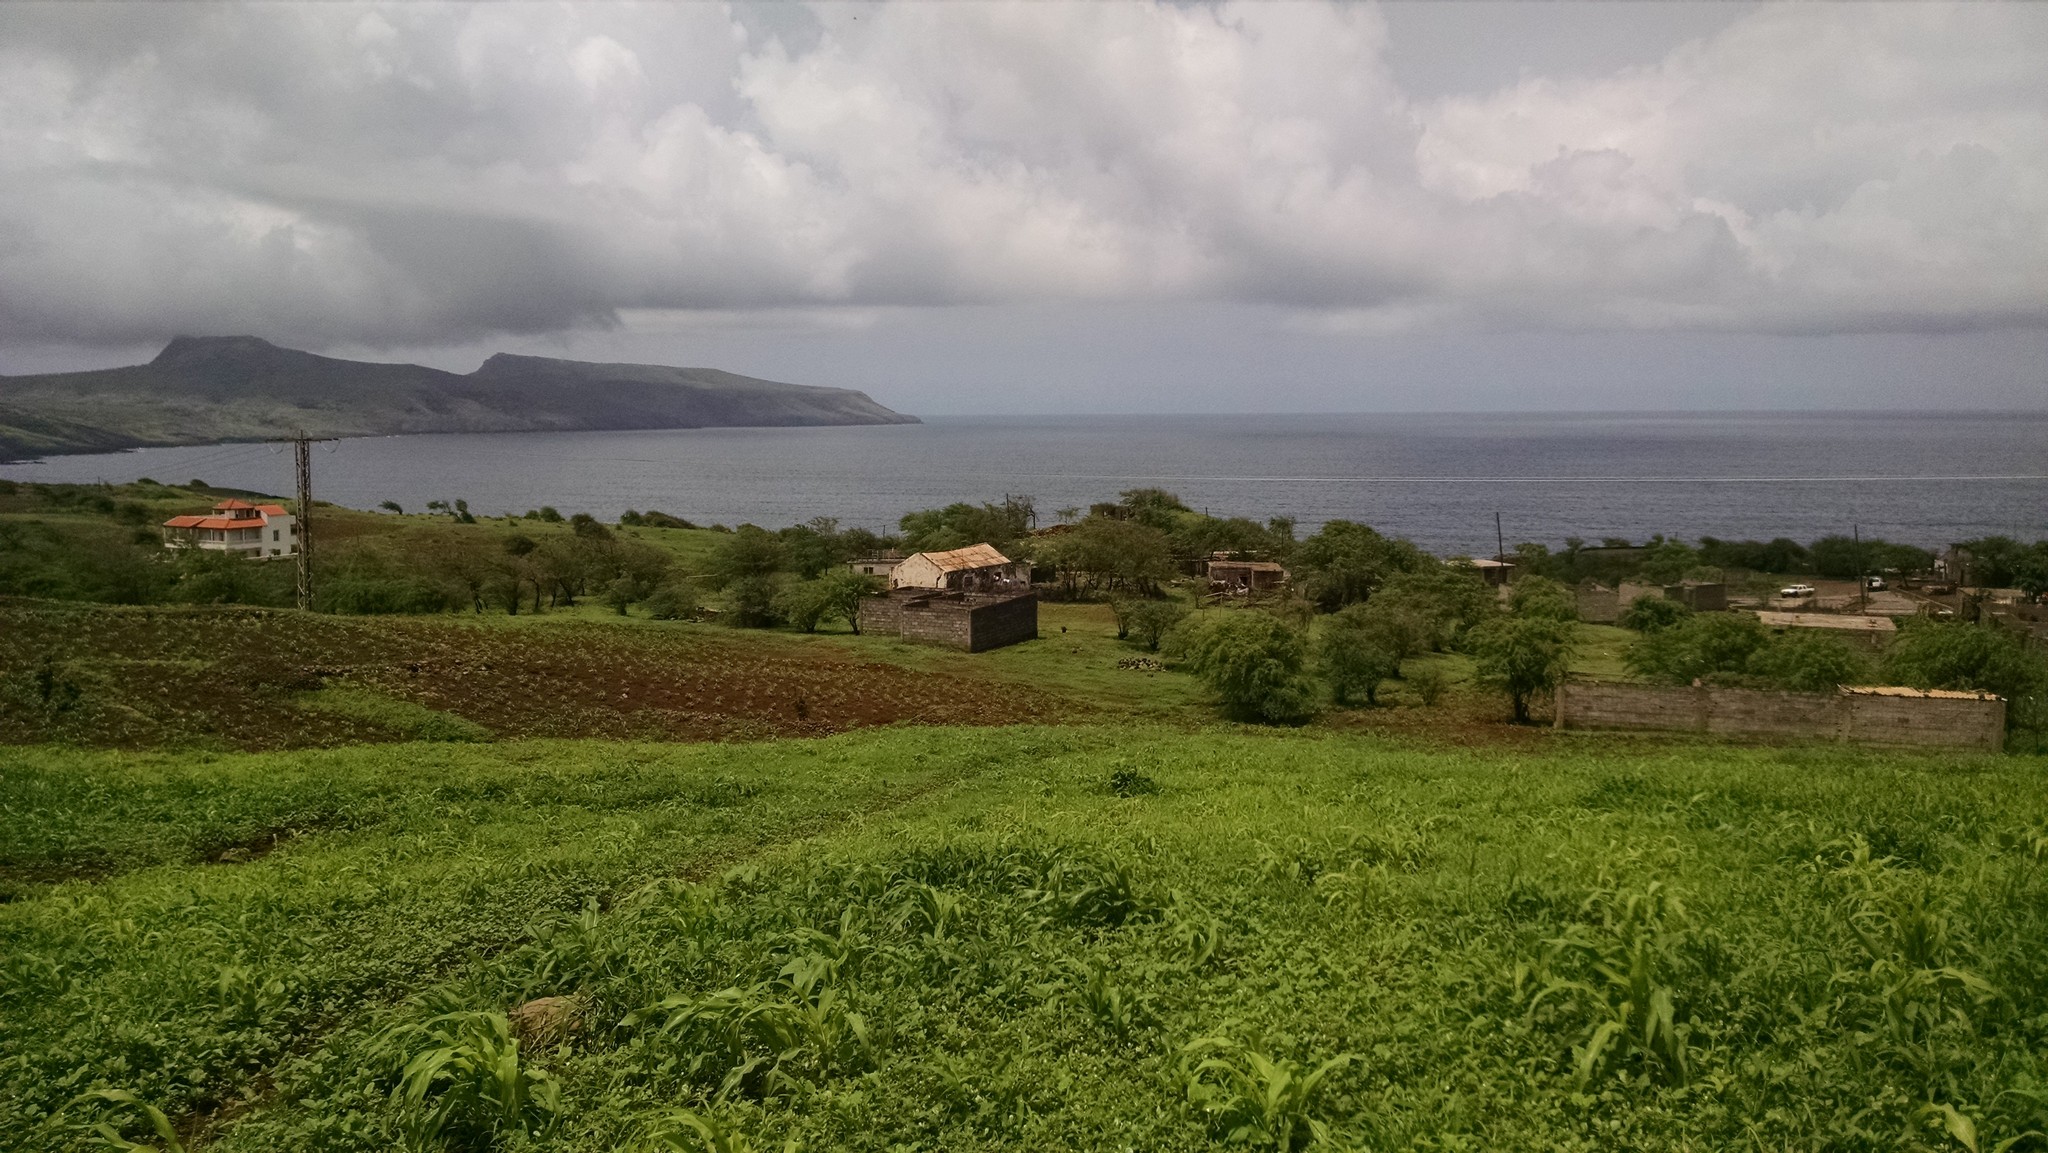
…and a local Association who was building a pig sty to help strengthen resilient pig production
Following the field trip, participants discussed the data they had collected, and began analysis according to the “3 x 5 model.” The discussions based on the initial data collection was already highlighting critical insights and questions which could be further explored through the next steps of the research
Moving forward, the core research team – led by Dr. Jerri Husch, will be extracting and organizing data around the 19 project demonstration sites. They will then select two sites where they will collect comprehensive context-related data which provide insights into the initiatives. We will be sharing more updates on this research process and the insights gathered as it evolves, so keep an eye on this blog!
Meanwhile, Vizzuality will be taking the information it learned during the workshop, including discussions with future users, to begin the “Wireframing” stage of the platform development. Stay tuned!